In our previous section, we had seen how to submit the updated data from chart to a Server-side script as form elements. Here, we will see how to read the updated data using JavaScript functions present on the same page.
Code samples discussed in this section is present in Download Package > Code > DragColumn folder.
//Get a reference to our chart
  var ourChart = FusionCharts("SelectChart");
//Now get the data as array.
  var arrData = ourChart.getDataWithId();
We first need to get a reference to the chart object. We do so using FusionCharts item reference method. Next, to get the data as array, we simply call the getDataWithId method of the chart. This method returns the data of chart in a 3-dimensional array. The structure of the array is as under:
| [0,0] - Empty | [0,1]- Dataset id | [0,2] - Dataset Id | [0,n]- Dataset Id | [0,n]- Dataset Id |
| [1,0] - Category label of data index 1 | Data for dataset [1] data index [1] - returned as an array with two elements.
Sub array [0] - Id of set Sub array [1] - Updated value of set |
Data for dataset [2] data index [1] - returned as an array with two elements.
Sub array [0] - Id of set Sub array [1] - Updated value of set |
Data for dataset [n] data index [m] - returned as an array with two elements.
Sub array [0] - Id of set Sub array [1] - Updated value of set |
Same as left |
| [2,0] - Category label of data index 2 | Data for dataset [1] data index [2] - returned as an array with two elements.
Sub array [0] - Id of set Sub array [1] - Updated value of set |
Same as above | Same as above | Same as left |
| [m,0] - Category label of data index m | Data for dataset [n] data index [m] - returned as an array with two elements.
Sub array [0] - Id of set Sub array [1] - Updated value of set |
Same as above | Same as above | Same as left |
| [m,0] - Category label of data index m | Same as above | Same as above | Same as above | Same as left |
| [m,0] - Category label of data index m | Same as above | Same as above | Same as above | Same as left |
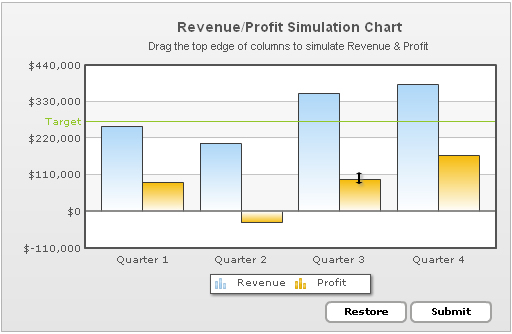
To make things simpler, let us consider the following XML:
<chart palette='1' caption='Revenue / Profit Simulation Chart' subcaption='Drag the top edge of columns to simulate revenue and profit'
       showvalues='0' xAxisName='Quarter' yAxisName='Dollars' numberPrefix='$' formatNumberScale='1'
       defaultAnimation='0' showFormBtn='0'>
   <categories>
      <category label='Quarter 1' />
      <category label='Quarter 2' />
      <category label='Quarter 3' />
      <category label='Quarter 4' />
   </categories>
   <dataset id='R' seriesName='Revenue' allowNegativeDrag='0'>
      <set id='R1' value='3554800' />
      <set id='R2' value='3014800' />
      <set id='R3' value='2737200' />
      <set id='R4' value='3540700' />
   </dataset>
   <dataset id='P' seriesName='Profit'>
      <set id='P1' value='870000' />
      <set id='P2' value='-419400' />
      <set id='P3' value='452600' />
      <set id='P4' value='717300' allowNegativeDrag='0'/>
   </dataset>
   <trendlines>
      <line startValue='2800000' endValue='3500000' color='009900' displayValue='Target' isTrendZone='1' alpha='10' valueOnRight='1'/>
   </trendlines>
   <styles>
      <definition>
         <style name="myCaptionFont" type="font" font="Arial" size="14" bold="1" />
         <style name="mySubCaptionFont" type="font" font="Arial" size="10" bold="0" />
      </definition>
      <application>
         <apply toObject="Caption" styles="myCaptionFont" />
         <apply toObject="SubCaption" styles="mySubCaptionFont" />
      </application>
   </styles>
</chart>
This XML generates a chart as under:
Now, without editing this data visually, if you return the data of chart as array using the getDataWithId() method of the chart object, the tabular mapping of returned array can be traced as under:
| (empty) | Revenue | Profit |
| Quarter 1 | [R1,3554800] | [P1,870000] |
| Quarter 2 | [R2,3014800] | [P2,-419400] |
| Quarter 3 | [R3,2737200] | [P3,452600] |
| Quarter 4 | [R4,3540700] | [P4,717300] |
If you map this with XML, you will find the following:
- [0,0] index of array is empty
- The first row in returned array contains the series name of each dataset placed horizontally (sequentially)
- The first column in returned array contains the labels of all the categories
- Rest of the columns map to respective category and dataset. For each data, its id and last updated value on chart in returned. In our example, since we have not changed any data visually on the chart, it is showing the original data.
Similar to getDataWithId() function is getData() function, but with one dimension of data less. Unlike getDataWithId() method, that returns both the id and updated value of each data on the chart, this method just returns the value of each data. Thus, the return array is now converted into a 2-dimensional array, where each data cell just contains a numeric value representing the final value of data on the chart.
The tabular mapping of array returned by this method can be traced as under:
| (empty) | Revenue | Profit |
| Quarter 1 | 3554800 | 870000 |
| Quarter 2 | 3014800 | -419400 |
| Quarter 3 | 2737200 | 452600 |
| Quarter 4 | 3540700 | 717300 |
Fairly simple. We just have the values now in each data cell, which can be directly accessed by the index of the 2-dimensional array.
See it live!
The chart also provides a method to read the updated data in XML format. This method is named as getXMLData() and can be invoked as under:
//Get a reference to our chart
var ourChart = FusionCharts("SelectChart");
//Get the data from chart
var xmlRtn = ourChart.getXMLData();
//Show it to user in alert box.
alert(xmlRtn);
You can also set the drag-able charts' upper and lower limits using JavaScript APIs. Moreover, you can also retrieve the current upper and the lower limits of the chart using JavaScript APIs.
The functions used to achieve these are:
- setUpperLimit: This function sets a new upper limit of the chart. The function takes a numeric value as a parameter. If the value is greater than the maximum value of all the dataplots of the chart, it sets the new upper limit of the chart and returns true. When the value passed to the function is less than the maximum value of all the dataplots of the chart, it fails to set the upper limit and returns false.
- setLowerLimit: This function sets a new lower limit of the chart. The function takes a numeric value as a parameter. If the value is less than the minimum value of all the dataplots of the chart, it sets the new lower limit of the chart and returns true. When the value passed to the function is more than the minimum value of all the dataplots of the chart, it fails to set the lower limit and returns false.
- getUpperLimit: This function returns the current upper limit of the chart.
- getLowerLimit: This function returns the current lower limit of the chart.
Examples:
Set Limits:
// Proposed upper limit
var newUpperLimit = 100000;
var newLowerLimit = -5000;
//Get a reference to our chart
var ourChart = FusionCharts("PredictionChart");

//Set the upper Limit and confirm
var status = ourChart.setUpperLimit( newUpperLimit );
//Show the status to user in alert box.
alert(status ? "The upper limit has been successfully set to " : "Failed setting the upper limit to ") + newUpperLimit;

//Set the lower Limit and confirm
status = ourChart.setLowerLimit( newLowerLimit );
//Show the status to user in alert box.
alert(status ? "The lower limit has been successfully set to " : "Failed setting the lower limit to ") + newUpperLimit;
Get Limits:
//Get a reference to our chart
var ourChart = FusionCharts("PredictionChart");

//get the current Upper Limit and Lower limit
var latestUpperLimit = ourChart.getUpperLimit();
var latestLowerLimit = ourChart.getLowerLimit();

//Show the status to user in alert box.
alert( "The current upper limit is: " + latestUpperLimit + ", and the current lower limit is:" + latestLowerLimit);
Using all this information, we have built a simple example where we pull data from chart and render it dynamically in tabular format at Client-side using JavaScript. The code for this is contained in Chart.html in Download Package > Code > DragColumn folder.
See it live!