In this page, we will learn how to render charts and gauges from FusionCharts XT, PowerCharts XT, FusionWidgets XT and maps from FusionMaps XT in a single web page.
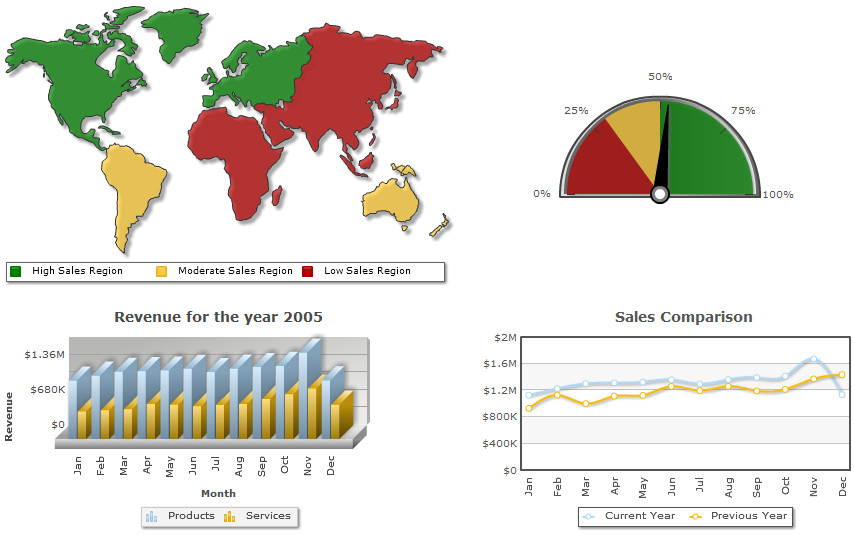
In this example, we will demonstrate a sales dashboard displaying a world map, an angular gauge, a Column 3D chart and a Spline chart. You can explore which geography generates what kind of revenue, see the profit margin, the breakdown of total revenue into monthly revenue from products and services and compare the overall revenue with that of the previous year. The page will look like the image below:
The process of embedding multiple charts and maps is similar to that of embedding multiple maps in a single page. To create this example the steps are as follows:
- From individual packs of the products, copy all the necessary javascript files and keep them in a single folder (say "JS"). The necessary JavaScript files are:
- FusionCharts.js (from FusionMaps XT pack or from the latest pack you have)
- FusionCharts.HC.js (from FusionMaps XT pack or from the latest pack you have)
- FusionCharts.HC.Maps.js (from FusionMaps XT pack)
- FusionCharts.HC.world.js (from FusionMaps XT pack)
- FusionCharts.HC.Charts.js (from FusionCharts XT pack)
- FusionCharts.HC.PowerCharts.js (from PowerCharts XT pack)
- FusionCharts.HC.Widgets.js (from FusionWidgets XT pack)
- jquery.min.js (from any of the packs)
- You can copy the chart and map SWF files from individual packs to a single folder or multiple folders. The necessary SWF files for the above example are:
- FCMap_World.swf (from FusionMaps XT pack)
- Column3D.swf (from FusionCharts XT pack)
- MSSpline.swf (from PowerCharts XT pack)
- AngularGauge.swf (from FusionWidgets XT pack)
For this example, we copy all the SWF files to single folder named "SWF".
- Each map and chart on the page should have a unique DOM-Id (which is specified in the JavaScript constructor).
- Each map and chart should be denoted by a unique JavaScript variable name (example, var worldMap = new FusionCharts (...); var columnChart = new FusionCharts(...); ).
- Each map should be rendered in a separate HTML container (DIV, SPAN etc), each container having unique id. The map embedding code must contain a reference to the ID of the container where the map is to be rendered ( render("worldMapContainer") ; .. render("chartContainerSpline"); ).
The following sample code embeds maps and charts into a single HTML page :
<html>
<head>
	<title>Creating maps and charts in a single page</title>
		<script type="text/javascript" src="JS/FusionCharts.js"></script>
</head>
	<body>
		<table border="0" cellspacing="5" cellpadding="0">
			<tr>
			 <td>
				<div id="worldMapContainer"></div>
				<script type="text/javascript">
				 // Uncomment the line below to render JavaScript charts and maps
				 //FusionCharts.setCurrentRenderer("javascript");
 				 var worldMap = new FusionCharts("SWF/FCMap_World.swf", "Map1Id", "480", "300", "0");
				 worldMap.setXMLUrl("Data/RegionWiseSales.xml");
				 worldMap.render("worldMapContainer");
				</script>
			 </td>
			 <td>
				<div id="gaugeDiv"></div>
				<script type="text/javascript">
				 var ProfitMargin = new FusionCharts("SWF/AngularGauge.swf", "chart1", "300", "155", "0");
				 ProfitMargin.setXMLUrl("Data/ProfitMargin.xml");
				 ProfitMargin.render("gaugeDiv");
				</script>
			 </td>
			</tr>
			<tr>
			 <td>
				<div id="revenueDiv"></div>
				<script type="text/javascript">
				 var revenueChart = new FusionCharts("SWF/MSColumn3D.swf", "chart2", "400", "250", "0");
				 revenueChart.setXMLUrl("Data/Revenue2005.xml");
				 revenueChart.render("revenueDiv");
				</script>
			 </td>
			 <td>
				<div id="chartContainerSpline"></div>
				<script type="text/javascript">
				 var salesComparison = new FusionCharts("SWF/MSSpLine.swf", "chart3", "400", "250", "0");
				 salesComparison.setXMLUrl("Data/SalesComparison.xml");
				 salesComparison.render("chartContainerSpline");
				</script>
			 </td>
			</tr>
		</table>
	</body>
</html>
See it live!
Instead of keeping all the JavaScript files and SWF files of each product in one common folder you can also keep the files in different folders. For example -
- FusionCharts.HC.Charts.js and Column3D.swf in a folder named "Charts"
- FusionCharts.HC.Widgets.js and AngularGauge.swf in a folder named "Widgets"
- FusionCharts.HC.PowerCharts.js and MSSpline.swf in a folder named "PowerCharts"
- FusionCharts.js, FusionCharts.HC.js, FusionCharts.HC.Maps.js, jquery.min.js, FusionCharts.HC.world.js and FCMap_World.swf in a folder named "Maps"
- "Charts", "Widgets", "PowerCharts" and "Maps" folders are present in a single parent folder
In cases like the above:
- You need to provide correct path of the SWF files. The path of the SWF files should be relative to the web page or HTML file.
- More importantly, you need to explicitly declare the path of each product specific JavaScript module. Use:
- FusionCharts.options.html5ChartsSrc property to set the path for FusionCharts.HC.Charts.js ( FusionCharts XT JavaScript module)
- FusionCharts.options.html5WidgetsSrc property to set the path for FusionCharts.HC.Widgets.js ( FusionWidgets XT JavaScript module)
- FusionCharts.options.html5PowerChartsSrc property to set the path for FusionCharts.HC.PowerCharts.js ( PowerCharts XT JavaScript module)
- FusionCharts.options.html5MapsSrc property to set the path for FusionCharts.HC.Maps.js ( FusionMaps XT JavaScript module)
Note: The paths for the JavaScript modules should always be relative to the path of FusionCharts.js and NOT relative to the path of the web page or HTML file.
The code for the above folder structure will look as under:
<html>
<head>
	<title>Creating maps and charts in a single page</title>
		<script type="text/javascript" src="Maps/FusionCharts.js"></script>
		<script type="text/javascript">
				FusionCharts.options.html5WidgetsSrc = "../Widgets/FusionCharts.HC.Widgets.js";
				FusionCharts.options.html5ChartsSrc = "../Charts/FusionCharts.HC.Charts.js";
				FusionCharts.options.html5PowerChartsSrc = "../PowerCharts/FusionCharts.HC.PowerCharts.js";

		</script>
</head>
	<body>
		<table border="0" cellspacing="5" cellpadding="0">
			<tr>
			 <td>
				<div id="worldMapContainer"></div>
				<script type="text/javascript">
				 // Uncomment the line below to render JavaScript charts and maps
				 //FusionCharts.setCurrentRenderer("javascript");
 				 var worldMap = new FusionCharts("Maps/FCMap_World.swf", "Map1Id", "480", "300");
				 worldMap.setXMLUrl("Data/RegionWiseSales.xml");
				 worldMap.render("worldMapContainer");
				</script>
			 </td>
			 <td>
				<div id="gaugeDiv"></div>
				<script type="text/javascript">
				 var ProfitMargin = new FusionCharts("Widgets/AngularGauge.swf", "chart1", "300", "155");
				 ProfitMargin.setXMLUrl("Data/ProfitMargin.xml");
				 ProfitMargin.render("chart1");
				</script>
			 </td>
			</tr>
			<tr>
			 <td>
				<div id="revenueDiv"></div>
				<script type="text/javascript">
				 var revenueChart = new FusionCharts("Charts/MSColumn3D.swf", "chart2", "400", "250", "0");
				 revenueChart.setXMLUrl("Data/Revenue2005.xml");
				 revenueChart.render("revenueDiv");
				</script>
			 </td>
			 <td>
				<div id="chartContainerSpline"></div>
				<script type="text/javascript">
				 var salesComparison = new FusionCharts("PowerCharts/MSSpLine.swf", "chart3", "400", "250", "0");
				 salesComparison.setXMLUrl("Data/SalesComparison.xml");
				 salesComparison.render("chartContainerSpline");
				</script>
			 </td>
			</tr>
		</table>
	</body>
</html>
In the above code, we have declared the relative paths of all the JavaScript module files explicitly using the following properties:
- FusionCharts.options.html5WidgetsSrc = "../Widgets/FusionCharts.HC.Widgets.js"
- FusionCharts.options.html5ChartsSrc = "../Charts/FusionCharts.HC.Charts.js"
- FusionCharts.options.html5PowerChartsSrc = "../PowerCharts/FusionCharts.HC.PowerCharts.js"
Important: The above mentioned properties need to be declared before rendering of any chart, gauge or map in the page. To be safe, we have placed this declaration just after including FusionCharts.js in the HTML page.
Note: In the example above, we have not explicitly defined the path of FusionCharts.HC.Maps.js since it resides in the same folder as that of FusionCharts.js. This enables FusionCharts.js to load it automatically from the same location.