The entire export process of FusionMaps XT is a multi-step process involving various elements, including:
- The map itself - This is the SWF file that you embed in your page to generate the map. The map is responsible to take its own snapshot so that further processes can take place.
- FusionCharts JavaScript Class (FusionCharts.js) - The JavaScript class used to embed the map.
- FusionCharts Export Handlers (Server-side)- In case of server-side export, these server-side scripts accept and convert the bitmap snapshot of maps into images/PDFs.
- FusionCharts Export Component (Client-side) - In case of client-side export, FusionCharts Export Component accepts the bitmap snapshot of map and converts into the required export format. This is present as a Flash 10 SWF file.
- FusionCharts Export Component JavaScript class (FusionChartsExportComponent.js) - This JavaScript class helps you initiate the FusionCharts Export Component object and to set the JavaScript communication channel between the map and FusionCharts Export Component. It has additional logic for cross-browser compatibility and error handling.
Existing users: Starting FusionMaps XT, use of FusionMapsExportComponent.js is deprecated. Use FusionChartsExportComponent.js instead. It is recommended that you replace all references FusionMapsExportComponent.js to FusionChartsMapsExportComponent.js in your code.
These elements when combined, provide an elegant approach that allow you to export maps as images.
Yes - we agree that FusionMaps XT renders maps in Flash or JavaScript. Flash uses Adobe Flash Player to do the same. Remember that all of this happens in your browser - the SWF and JavaScript files are downloaded, XML is downloaded and then parsed and finally rendered as a map.
So, after the map has rendered in your browser, you can now invoke the export process of FusionMaps XT using either context menu of map, or JavaScript API. This is called the Trigger phase. When you do this, the following processes take place:
- First, the map reads the export process related parameters from the XML data. These parameters help you configure whether to export at client-side, or server-side. You can also configure cosmetic properties of the Export map dialog box.
- The map now enters into what is called the Capture Phase. In this phase, the map takes a bitmap snapshot of itself. This takes a few seconds depending on the size of the map. During this time, the map displays a "Capturing data" dialog box, the cosmetics of which are totally customizable.
- Once the "Capture Phase" is over, the map now sends this data to FusionCharts Export handlers, as explained later. This is the start of Process Phase.
- The Export handlers accept the data, process it, and finally return an image/PDF based on the choice of user, which marks the end of Process Phase.
- In the final phase called Callback phase, the export handler can now invoke callback JavaScript functions to notify you that the export process has completed.
The entire process can be visualized as under:
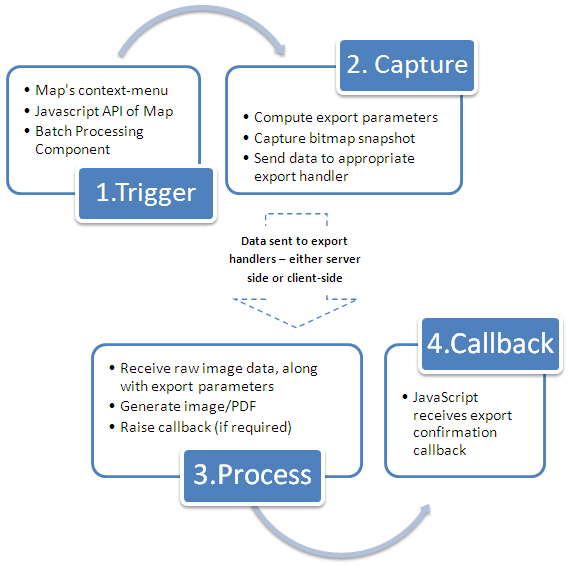
We wish to lay emphasis on one point again - Whenever a map needs to export as image/PDF (either server-side or client-side), it first necessarily needs to render itself in browser. Once it has rendered in the browser, you can then invoke the JavaScript API to automatically start the export process, without needing any user action.
While the list looks scary at the first sight, let us assure you that setting up all these things is just a matter of minutes, involving just copying-pasting some files here and there, and configuring your XML for export related parameters. You do NOT need to write any of your own code to handle any of this - we've done the hard work so that you can relish it!
With that assurance, let's first quickly learn the various terminologies associated with FusionMaps Export process for once and for all!