The debug mode helps you look into what is happening behind the map scenes. It also lists out any errors, if present. You can use the debug window to trouble shoot all your maps. The debug window lists errors like:
- Error in loading data - reasons.
- Invalid XML data - possible reasons.
- If invalid style names are specified for Map OBJECTS.
- and a few more...
In each map, you can activate the debug mode by just enabling the debug flag. A typical debug window for a map that rendered successfully using Data URL method looks as under:
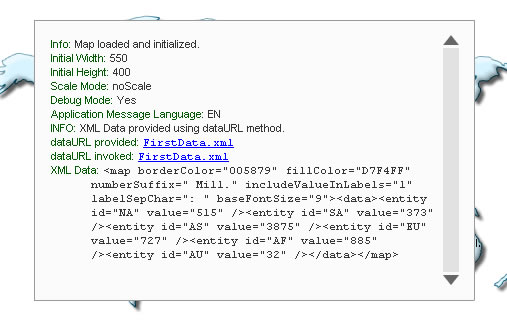
Here, you can see the map with it's Debug Window. The Debug Window contains a lot of information about the map. The contents of the above debug window can be listed as under:
Info: Map loaded and initialized.
Initial Width: 550
Initial Height: 400
Scale Mode: noScale
Debug Mode: Yes
Application Message Language: EN
INFO: XML Data provided using dataURL method.
dataURL provided: FirstData.xml
dataURL invoked: FirstData.xml
XML Data: <map borderColor="005879" fillColor="D7F4FF" numberSuffix=" Mill." includeValueInLabels="1" labelSepChar=": " baseFontSize="9"><data><entity id="NA" value="515" /><entity id="SA" value="373" /><entity id="AS" value="3875" /><entity id="EU" value="727" /><entity id="AF" value="885" /><entity id="AU" value="32" /></data></map>
From the above Debug Window, you can get the following information:
- A message when map is loaded and initialized properly.
- Specified width and height.
- Scale Mode, Debug Mode, Application Message Language.
- Method using which XML data has been provided - Can be Data URL or Data String .
- If Data URL method, then link to original Data URL provided and the invoked one. There could be a difference between the two, if your Data URL is URL-Encoded. In that case, FusionMaps XT converts it into normal form before invoking it. If you get an error in loading data, you can see here if FusionMaps XT is invoking the right URL. You can also click on the URL to open the page in browser to see any errors thrown by your server side scripting language.
- Finally the XML data retrieved is shown for your reference.
To hide the debug window and see the map below, in Debug Mode, you can click inside the respective map and then press Shift + D. To show it back, again press Shift + D.
To enable the debug mode for any of your maps, you just need to set the debugMode flag to 1.
FusionMaps XT.
</div>
<script type="text/javascript">
var map = new FusionCharts("FCMap_World.swf", "Map1Id", "750", "400", "1", "0");
map.setXMLUrl("FirstData.xml");
map.render("mapdiv");
</script>
The parameter after map width and height is the debugMode flag. Set it to 1, and run the map. You'll now see it with Debug Window.
Use the debug window when building the map. Once the map runs fine, set the flag back to 0, so that your end users just see the map and not the debug window.
Note: Debug Mode error won't help you solve problems relating to path of SWF file, as the debug mode is a module inside the SWF file. So, unless the SWF file path is correct, you cannot switch debug mode on.
Shown below are a few example errors show in debug mode:
- NOT specified either Data URL or Data String . So you can see the Warning above.
- NOT placed a default Data.xml file in the folder. So, FusionMaps XT tries to look for a Data.xml file, but it cannot find it. So, you get an "Error in Loading Data" message, and the debug window lists the possible reasons for it.
There are more errors and messages that debug window can trap, which we've not shown here. Examples: style related error messages, invalid XML reasons, JavaScript handler error messages etc. All the errors get caught in the Debug Window and you can effectively use it to correct them.
The Debug Window is aimed at making your lives simpler as developers.