FusionCharts PHP Class API > First Chart
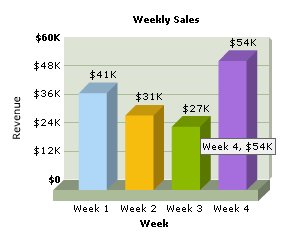
| Week | Previous Month (sales) |
| Week 1 | $40800 |
| Week 2 | $31400 |
| Week 3 | $26700 |
| Week 4 | $54400 |
<?php
# Include FusionCharts PHP Class
include('../Class/FusionCharts_Gen.php');
# Create Column3D chart Object
$FC = new FusionCharts("Column3D","300","250");
# set the relative path of the swf file
$FC->setSWFPath("../FusionCharts/");
# Set chart attributes
$strParam="caption=Weekly Sales;xAxisName=Week;yAxisName=Revenue;numberPrefix=$;decimalPrecision=0;formatNumberScale=1";
$FC->setChartParams($strParam);
# add chart values and category names
$FC->addChartData("40800","name=Week 1");
$FC->addChartData("31400","name=Week 2");
$FC->addChartData("26700","name=Week 3");
$FC->addChartData("54400","name=Week 4");
?>
<html>
<head>
<title>First Chart Using FusionCharts PHP Class</title>
<script language='javascript' src='../FusionCharts/FusionCharts.js'></script>
</head>
<body>
<?
# Render Chart
$FC->renderChart();
?>
</body>
</html>
Let's analyze the steps involved in the above code:
- We include FusionCharts_Gen.php in the program. This file contains FusionCharts PHP Class codes.
include('../Class/FusionCharts_Gen.php');
- We create a Column3D chart object.
$FC = new FusionCharts("Column3D","300","250");
The constructor of FusionCharts PHP Class is invoked and it initializes chart type, chart width and chart height properties of the object.
- Next, we set relative path to the chart SWF files using setSwfPath() function. This is the path from which we load the chart SWF files.
$FC->setSWFPath("../FusionCharts/");
- We store all desired chart attributes in the $strParam variable and set chart attributes using setChartParams() function.
$FC->setChartParams($strParam);
- Now, we provide chart data with addChartData() function.We pass the value first and then the category name against each value as a parameter i.e., name=Week 1 etc.
$FC->addChartData("40800","name=Week 1");
$FC->addChartData("31400","name=Week 2");
$FC->addChartData("26700","name=Week 3");
$FC->addChartData("54400","name=Week 4");
- Finally, we include FusionCharts.js - FusionCharts JavaScript Embedding Class.
- And display the chart using renderChart() function.
$FC->renderChart();
When we declare an object of FusionCharts PHP Class the constructor is invoked. This constructor accepts the parameters that sets the chart type, chart width and height.
In the code above the statement $FC = new FusionCharts("Column3D","300","250"); invokes the constructor which sets chart type as Column3D; width to 300 pixels and height to 250 pixels.
Hence we can use this to set the desired dimension of our charts. Let's set our chart's dimension to 450 x 350 pixels.
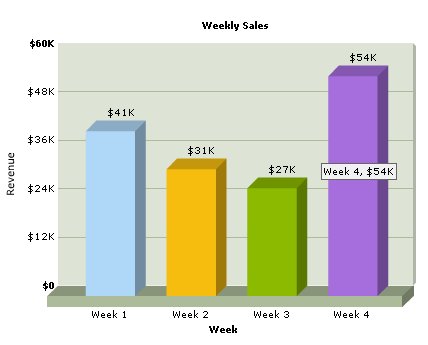
$FC = new FusionCharts("Column3D","300","250");
To make a Pie Chart for our Weekly Revenue data, we have to use the following specification while creating FusionCharts class object:
$FC = new FusionCharts("Pie3D","300","250");

| Chart Type | Description |
| Column2D | Single Series Column 2D Chart |
| Column3D | Single Series Column 3D Chart |
| Line | Single Series Line Chart |
| Pie3D | Single Series Pie 3D Chart |
| Pie2D | Single Series Pie 2D Chart |
| Bar2D | Single Series Bar 2D Chart |
| Area2D | Single Series Area 2D Chart |
| Doughnut2D | Single Series Doughnut 2D Chart |
| MSColumn3D | Multi-Series Column 3D Chart |
| MSColumn2D | Multi-Series Column 2D Chart |
| MSArea2D | Multi-Series Column 2D Chart |
| MSLine | Multi-Series Line Chart |
| MSBar2D | Multi-Series Bar Chart |
| StackedColumn2D | Stacked Column 2D Chart |
| StackedColumn3D | Stacked Column 3D Chart |
| StackedBar2D | Stacked Bar 2D Chart |
| StackedArea2D | Stacked Area 2D Chart |
| MSColumn3DLineDY | Combination Dual Y Chart (Column 3D + Line) |
| MSColumn2DLineDY | Combination Dual Y Chart (Column 2D + Line) |