Creating your First Chart
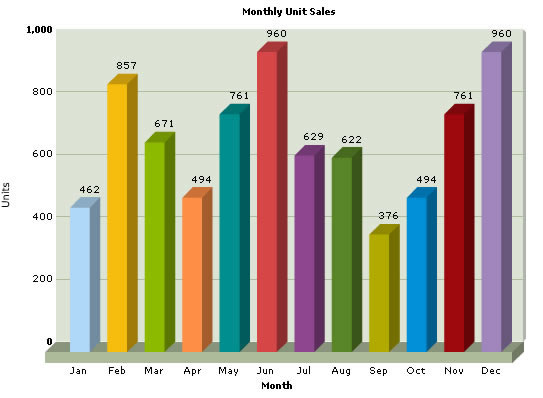
Here, we'll guide you through the process of creating your first chart. For a head start, we'll create a simple 3D Column Chart to visually depict Monthly Sales Summary.
To create any chart using FusionCharts, you need to assemble three things:
- SWF File for the chart that you want to create. We want to create a 3D Column Chart, whose SWF file is named as Column3D.swf. All the chart SWF files are present in Download Package > Charts folder.
- XML Data File. FusionCharts accepts data only in a pre-defined XML format. So, you'll need to convert your data to XML format - either using a server side scripting language or manually.
- HTML Wrapper File. This HTML file would contain the code to embed the chart.
Before we get on to assemble the above items, let's create a new folder that will serve as our playground for our trials and researches. Create a new folder named as c:\FusionCharts on your computer. We'll keep all our examples within this folder.
For our first chart example, we'll create another folder within the above folder. Name the new folder as MyFirstChart so that the structure now looks like c:\FusionCharts\MyFirstChart.
Now, to build the chart, we need to copy chart SWF files within this folder. Before that, create another folder FusionCharts under c:\FusionCharts, so that the new folder looks like c:\FusionCharts\FusionCharts. This folder would be our container for all the chart SWF files.
Copy all the chart SWF files (from Download Package > Charts folder) into this newly created folder (c:\FusionCharts\FusionCharts\).
This folder serves as the central location for charts. All our examples would use the charts contained in this single folder.
Now that the SWF files are set up, we move on to see how to create the XML data for our chart.
Before we build the chart, we first need to have the data that we'll represent on the chart. Since we're plotting monthly sales summary for a given year, our data in tabular form would look something like below. Each month given below would be represented on the chart as a 3D column.
| Month | Net Revenue |
| January | $17400 |
| February | $19800 |
| March | $21800 |
| April | $23800 |
| May | $29600 |
| June | $27600 |
| July | $31800 |
| August | $39700 |
| September | $37800 |
| October | $21900 |
| November | $32900 |
| December | $39800 |
Now, as earlier mentioned, FusionCharts necessarily needs its data in pre-defined XML format. It cannot read any other format (including Excel, CSV or text data) apart from XML. So, we need to convert this data into XML.
FusionCharts v3, the commercial version, has a visual XML Generator Utility to help you easily convert this tabular data into XML.
The converted XML data would look as under:
<set name='Jan' value='462' color='AFD8F8' />
<set name='Feb' value='857' color='F6BD0F' />
<set name='Mar' value='671' color='8BBA00' />
<set name='Apr' value='494' color='FF8E46' />
<set name='May' value='761' color='008E8E' />
<set name='Jun' value='960' color='D64646' />
<set name='Jul' value='629' color='8E468E' />
<set name='Aug' value='622' color='588526' />
<set name='Sep' value='376' color='B3AA00' />
<set name='Oct' value='494' color='008ED6' />
<set name='Nov' value='761' color='9D080D' />
<set name='Dec' value='960' color='A186BE' />
</graph>
Punch the above code in a text editor (e.g., Notepad) and save it as Data.xml under c:\FusionCharts\MyFirstChart folder.
And yeah - don't worry about whatever spaghetti stuff you have just written - we'll soon cover them. Basically, what we've done above can be listed in the following points:
- We've created the root <graph> element, with a few attributes to define captions, axis names and number prefix character, to consist everything.
- For each data row, we've created a <set> element. name attribute of this element represents the month name and value attribute represents the data that we want to plot.
Just as a measure to check if the XML document is structurally valid, open the file in your browser. You should be able to see the XML data document in a formatted way, without any errors.
And now, if you're running out of your patience to see this data in chart
format, let's quickly build the HTML container for this chart.
<head>
<title>My First FusionCharts</title>
</head>
<body bgcolor="#ffffff">
<OBJECT classid="clsid:D27CDB6E-AE6D-11cf-96B8-444553540000" codebase=http://download.macromedia.com/pub/shockwave/cabs/flash/swflash.cab#version=6,0,0,0" width="600" height="500" id="Column3D" >
<param name="movie" value="../FusionCharts/FCF_Column3D.swf" />
<param name="FlashVars" value="&dataURL=Data.xml&chartWidth=600&chartHeight=500">
<param name="quality" value="high" />
<embed src="../FusionCharts/FCF_Column3D.swf" flashVars="&dataURL=Data.xml&chartWidth=600&chartHeight=500" quality="high" width="600" height="500" name="Column3D" type="application/x-shockwave-flash" pluginspage="http://www.macromedia.com/go/getflashplayer" />
</object>
</body>
</html>
The code in bold above is the actual code that you need to place in your page to embed a FusionCharts chart.
In the above code, we've
- used <OBJECT> and <EMBED> tags to embed the 3D Column Chart (FCF_Column3D.swf) within the HTML page.
- used &dataUrl=Data.xml under FlashVars parameter to indicate the source of data to chart – Data.xml in this case. This method of indicating data is referred to as dataURL method of providing data.
- specified chart width as 600 and chart height as 300. Used chartWidth and chartHeight variables additionally in FlashVars to convey the size to chart, else only the container gets resized.
To display a Flash movie correctly in a browser, HTML page should contain specific tags that specify the Flash movie file to be opened and played. There are two tags which are intended for it: <OBJECT> and <EMBED> tags.
These two tags are required to display a Flash movie in different Internet
browsers properly. The <OBJECT>
tag is used by Internet Explorer under Microsoft Windows and the
<EMBED> tag is used by Netscape Navigator under Microsoft
Windows or Mac OS. Each of these two tags acts in the same way, however
using only one tag may cause incompatibility of one of the browsers. To
ensure that most browsers will play your Flash movies, you should place
the <EMBED> tag nested within the
<OBJECT> tag as shown in the example.
ActiveX-enabled browsers will ignore the <EMBED>
tag inside the <OBJECT> tag. Netscape
and old Microsoft browsers will not recognize the <OBJECT>
tag and will use only the <EMBED>
tag to load the Macromedia Flash Player.
If for some reasons, you do not see a chart similar to one shown above, run through the following checks:
If you see an endless loading progress bar in your browser, or if the right click menu (right click at the place where the chart is supposed to be) shows "Movie not loaded", check the following:
- Have you pasted the chart SWF files in FusionCharts folder?
- Have you provided the SWF path properly in your Chart.html page?
- Do you have Adobe Flash Player 6 (or above) installed for this browser?
- Have you enabled your browser to show ActiveX controls? Normally, all browsers are Flash-enabled.
If you get a "Error in Loading Data" message, check the following:
- Whether Data.xml is in the same folder as the Chart.html HTML file?
- Whether Data.xml is named as Data.xml and not Data.xml.txt, as many basic text editors append .txt after the file name?
If you get an "Invalid XML Data" message, it means that the XML data document is malformed. Check it again for common errors like:
- Difference in case of tags. <graph> should end with </graph> and not </Graph> or </GRAPH>
- Missing opening/closing quotation marks for any attributes. e.g., <graph caption=Monthly Sales' should be <graph='Monthly Sales'
- Missing closing tag for any element.
To check whether your final XML is ok, open it in your browser and you'll see the error.