Using FusionCharts with C# (ASP.NET) > Basic Examples
In this section we will build up simple charts using ASP.NET. We'll cover the following examples here:
- We'll use FusionCharts in ASP.NET with a pre-built Data.xml (which contains data to plot)
- We'll then change the above chart into a single page chart using dataXML method.
- Finally, we'll use FusionCharts JavaScript class to embed the chart.
Let's quickly see each of them.
Before you proceed with the contents in this
page, we strictly recommend you to please go through the section "How
FusionCharts works?".
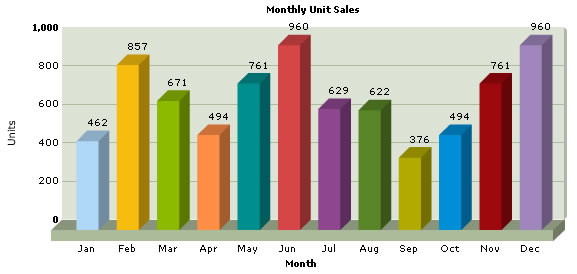
Let's now get to building our first example. In this example, we'll create a "Monthly Unit Sales" chart using dataURL method. For a start, we'll hard code our XML data in a physical XML document Data.xml and then utilize it in our chart contained in an ASP.NET Page (BasicChart.aspx).
Let's first have a look at the XML Data document:
<set name='Jan' value='462' color='AFD8F8' />
<set name='Feb' value='857' color='F6BD0F' />
<set name='Mar' value='671' color='8BBA00' />
<set name='Apr' value='494' color='FF8E46' />
<set name='May' value='761' color='008E8E' />
<set name='Jun' value='960' color='D64646' />
<set name='Jul' value='629' color='8E468E' />
<set name='Aug' value='622' color='588526' />
<set name='Sep' value='376' color='B3AA00' />
<set name='Oct' value='494' color='008ED6' />
<set name='Nov' value='761' color='9D080D' />
<set name='Dec' value='960' color='A186BE' />
</graph>
This XML is stored as Data.xml in Data Folder under BasicExample folder. It basically contains the data to create a single series chart to show "Monthly Unit Sales". We'll plot this on a Column 3D Chart. Let's see how to do that.
To plot a Chart that consumes this data, you need to include the HTML code to embed a Flash object and then provide the requisite parameters. To make things simpler for you, we've put all this functionality in InfoSoftGlobal.FusionCharts class inside the dll file FusionCharts.dll. This dll file is contained in Download Package > Code > VB_NET > bin. So, whenever you need to work with FusionCharts in ASP.NET, just use the defined functions in the InfoSoftGlobal.FusionCharts class and then you can work with FusionCharts very easily.
Let's see it in example. BasicChart.aspx contains the following code to render the chart:
<%@ Page Language="C#" %>
<%@ Import Namespace="InfoSoftGlobal" %>
<HTML>
<HEAD>
<TITLE>
FusionCharts Free - Simple Column 3D Chart
</TITLE>
</HEAD>
<BODY>
<%
//Create the chart - Column 3D Chart with data from Data/Data.xml
Response.Write(FusionCharts.RenderChartHTML("../FusionCharts/FCF_Column3D.swf", "Data/Data.xml", "", "myFirst", "600", "300", false));
%>
</BODY>
</HTML>
| Parameter | Description |
| chartSWF | SWF File Name (and Path) of the chart which you intend to plot. Here, we are plotting a Column 3D chart. So, we've specified it as ../../FusionCharts/Column3D.swf |
| strURL | If you intend to use dataURL method for the chart, pass the URL as this parameter. Else, set it to "" (in case of dataXML method). In this case, we're using Data.xml file, so we specify Data/Data.xml |
| strXML | If you intend to use dataXML method for this chart, pass the XML data as this parameter. Else, set it to "" (in case of dataURL method). Since we're using dataURL method, we specify this parameter as "". |
| chartId | Id for the chart, using which it will be recognized in the HTML page. Each chart on the page needs to have a unique Id. |
| chartWidth | Intended width for the chart (in pixels) |
| chartHeight | Intended height for the chart (in pixels) |
| debugMode | Whether to start the chart in debug mode. Please see Debugging your Charts section for more details on Debug Mode. This parameter is only applicable to FusionCharts v3. |
| registerWithJS | Whether to register the chart with JavaScript. Please see FusionCharts and JavaScript section for more details on this. This parameter is only applicable to FusionCharts v3. |
| transparent | Whether the the chart should have a transparent background in HTML page. Optional Property. This parameter is only applicable to FusionCharts v3. |
| scaleMode | Scaling option of the chart. It can take any value out of the four: "noscale", "exactfit", "noborder" and "showall". This parameter is only applicable to FusionCharts v3. |
| bgColor | Background color of the chart. If background color of the chart is not defined in XML, this property would be used to set the chart’s background. E.g. #ff0000. This parameter is only applicable to FusionCharts v3. |
| language | Preferred language. e.g. EN. This parameter is only applicable to FusionCharts v3. |
When you now run this page, you'll see a chart like the one below.
If you do not see a chart like the one below, please follow the steps listed in Debugging your Charts > Basic Troubleshooting section of this documentation.
<%@ Page Language="C#" AutoEventWireup="false" CodeFile="BasicDataXML.aspx.cs" Inherits="BasicExample_BasicDataXML" %>
<HTML>
<HEAD>
<TITLE>
FusionCharts Free - Simple Column 3D Chart using dataXML method
</TITLE>
</HEAD>
<BODY>
<asp:Literal ID="FCLiteral" runat="server"></asp:Literal>
</BODY>
</HTML>
using System;
using System.Data;
using System.Configuration;
using System.Collections;
using System.Web;
using System.Web.Security;
using System.Web.UI;
using System.Web.UI.WebControls;
using System.Web.UI.WebControls.WebParts;
using System.Web.UI.HtmlControls;
using InfoSoftGlobal;
public partial class BasicExample_BasicDataXML : System.Web.UI.Page
{
protected void Page_Load(object sender, EventArgs e)
{
// Generate chart in Literal Control
FCLiteral.Text = CreateCharts();
}
public string CreateCharts()
{
//This page demonstrates the ease of generating charts using FusionCharts.
//For this chart, we've used a string variable to contain our entire XML data.
//Ideally, you would generate XML data documents at run-time, after interfacing with
//forms or databases etc.Such examples are also present.
//Here, we've kept this example very simple.
//Create an XML data document in a string variable
string strXML;
strXML = "";
strXML += "<graph caption='Monthly Unit Sales' xAxisName='Month' yAxisName='Units' decimalPrecision='0' formatNumberScale='0'>";
strXML += "<set name='Jan' value='462' color='AFD8F8' />";
strXML += "<set name='Feb' value='857' color='F6BD0F' />";
strXML += "<set name='Mar' value='671' color='8BBA00' />";
strXML += "<set name='Apr' value='494' color='FF8E46'/>";
strXML += "<set name='May' value='761' color='008E8E'/>";
strXML += "<set name='Jun' value='960' color='D64646'/>";
strXML += "<set name='Jul' value='629' color='8E468E'/>";
strXML += "<set name='Aug' value='622' color='588526'/>";
strXML += "<set name='Sep' value='376' color='B3AA00'/>";
strXML += "<set name='Oct' value='494' color='008ED6'/>";
strXML += "<set name='Nov' value='761' color='9D080D'/>";
strXML += "<set name='Dec' value='960' color='A186BE'/>";
strXML += "</graph>";
//Create the chart - Column 3D Chart with data from strXML variable using dataXML method
return FusionCharts.RenderChartHTML("../FusionCharts/FCF_Column3D.swf", "", strXML, "myNext", "600", "300", false);
}
}
Here,
- We've defined the CreateCharts method, which is called from the ASP.NET page to render the chart. In this function, we build the XML and HTML.
- We've created the XML data document for the chart in an ASP.NET variable strXML using string concatenation. For the sake of demo, we've hard-coded our data in this variable. In your applications, you can build this data dynamically after interacting with databases or external sources of data.
- Finally, we return the chart HTML using RenderChartHTML() method present in InfoSoftGlobal.FusionCharts class. We've used dataXML method here, and as such we set the dataXML parameter as strXML. We leave dataURL parameter blank. RenderChart()is called form the Page_Load event lsitener.
When you see this chart, you'll get the same results as before.
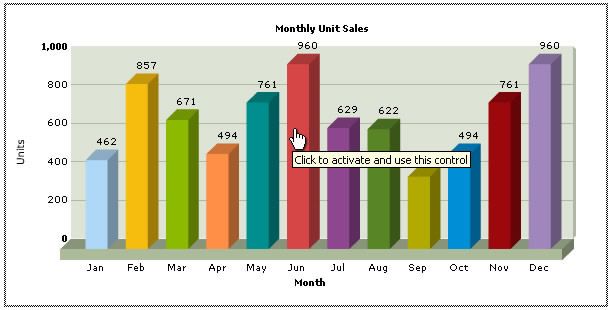
Internet Explorer asks you to "Click and activate..." to use the chart. This is happening because of a technical issue on behalf of Microsoft. As such, all Flash movies need to be clicked once before you can start interacting with them.
However, the good news is that there's a solution to it. This thing happens only when you directly embed the HTML code of the chart. It would NOT happen when you use JavaScript to embed the chart. To see how to embed using JavaScript at code level, please see Creating Your First Chart > JavaScript Embedding Section.
Again, to make things simpler for you, we've provided an ASP.NET function called RenderChart() which helps you wrap this JavaScript function in ASP.NET function, so that you don't have to get your hands dirty with JavaScript, Flash and HTML. This function is contained in the previously used InfoSoftGlobal.FusionCharts class.
Let's now quickly put up a sample to show the use of this function. We create
another ASP.NET page SimpleChart.aspx to use this function to plot a chart from data contained in our previously
created Data.xml file. Like before, SimpleChart.aspx contains the following code:
<%@ Page Language="C#" %>
<%@ Import Namespace="InfoSoftGlobal" %>
<script runat="server">
protected void Page_Load(object sender, EventArgs e)
{
//Create the chart - Column 3D Chart with data from Data/Data.xml
FCLiteral.Text = FusionCharts.RenderChart("../FusionCharts/FCF_Column3D.swf", "Data/Data.xml", "", "myFirst", "600", "300", false, false);
}
</script>
<HTML>
<HEAD>
<TITLE>
FusionCharts Free - Simple Column 3D Chart
</TITLE>
<%
//You need to include the following JS file, if you intend to embed the chart using JavaScript.
%>
<SCRIPT LANGUAGE="Javascript" SRC="../FusionCharts/FusionCharts.js"></SCRIPT>
</HEAD>
<BODY>
<asp:Literal ID="FCLiteral" runat="server"></asp:Literal>
</BODY>
</HTML>
In the above code, we've:
- Included FusionCharts.js file, which is required when using the JavaScript method. This file contains a JavaScript class that embeds FusionCharts on the client side. This file is present in Download Package > JSClass.
- Called RenderChart() function to render the chart.RenderChart()is called form the Page_Load event lsitener.
RenderChart() method is contained in InfoSoftGlobal.FusionCharts class; it returns the HTML code for the chart (using JavaScript embedding). Since we're using a physical Data.xml file here, we've used the dataURL method to provide the path of the file.
The RenderChart() method takes in the following parameters:
| Parameter | Description |
| chartSWF | SWF File Name (and Path) of the chart which you intend to plot. Here, we are plotting a Column 3D chart. So, we've specified it as ../../FusionCharts/Column3D.swf |
| strURL | If you intend to use dataURL method for the chart, pass the URL as this parameter. Else, set it to "" (in case of dataXML method). In this case, we're using Data.xml file, so we specify Data/Data.xml |
| strXML | If you intend to use dataXML method for this chart, pass the XML data as this parameter. Else, set it to "" (in case of dataURL method). Since we're using dataURL method, we specify this parameter as "". |
| chartId | Id for the chart, using which it will be recognized in the HTML page. Each chart on the page needs to have a unique Id. |
| chartWidth | Intended width for the chart (in pixels) |
| chartHeight | Intended height for the chart (in pixels) |
| debugMode | Whether to start the chart in debug mode. Please see Debugging your Charts section for more details on Debug Mode. This parameter is only applicable to FusionCharts v3. |
| registerWithJS | Whether to register the chart with JavaScript. Please see FusionCharts and JavaScript section for more details on this. This parameter is only applicable to FusionCharts v3. |
| transparent | Whether the the chart should have a transparent background in HTML page. Optional Property. This parameter is only applicable to FusionCharts v3. |
| scaleMode | Scaling option of the chart. It can take any value out of the four: "noscale", "exactfit", "noborder" and "showall". This parameter is only applicable to FusionCharts v3. |
| bgColor | Background color of the chart. If background color of the chart is not defined in XML, this property would be used to set the chart’s background. E.g. #ff0000. This parameter is only applicable to FusionCharts v3. |
| language | Preferred language. e.g. EN. This parameter is only applicable to FusionCharts v3. |