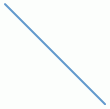
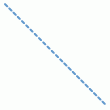
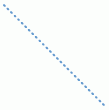
Let us take a look at the Line Annotation here. A line annotation looks as under:

...
<annotations>
<annotationGroup id='Grp1' >
<annotation type='line' x='200' y='200' toX='300' toY='300' color='639ACE'/>
</annotationGroup>
</annotations>
...
</chart>


...
<annotations>
<annotationGroup id='Grp1' >
<annotation type='line' x='200' y='200' toX='300' toY='300' color='639ACE' dashed='1' dashLen='1' dashGap='4'/>
</annotationGroup>
</annotations>
...
</chart>
| Attribute Name | Type / Range | Description |
| type | Rectangle, Circle, Polygon, Line, Arc, Text, Image | The type of the annotation you wish to draw on the chart. Needs to be set to Line to create a Line annotation. |
| x | Number | The starting x co-ordinate for the annotation. This x co-ordinate is relative to the x co-ordinate of the annotation group in which the annotation is placed. For example, if you have set the x co-ordinate of the annotation group as 50 and the x co-ordinate of the annotation is 100, then the effective x co-ordinate of the annotation would be 150 w.r.t to the starting position of the chart. |
| y | Number | The starting y co-ordinate for the annotation. This again is relative to the starting y co-ordinate of the annotation group in which the annotation is placed. |
| toX | Number | The ending x co-ordinate for the line. This co-ordinate is relative to the starting x-position of the annotation group in which the annotation is placed. |
| toY | Number | The ending y co-ordinate for the line. This co-ordinate is relative to the starting y-position of the annotation group in which the annotation is placed. |
| color | Hex Color (without the '#') | A generic color for the annotation from which font color, fill color and border color (whichever applies) will be derived automatically. |
| alpha | Number(1-100) | The alpha(transparency) of the annotation. By default, it would be set to 100. |
| thickness | Number | The thickness of the line. |
| Dash properties | ||
| dashed | Boolean (0 or 1) | Whether the line would be dashed or not. |
| dashLen | Number | The length of the dash in the line. |
| dashGap | Number | The gap between 2 dashes in a line. |

<chart ... >
...
<annotations>
<annotationGroup>
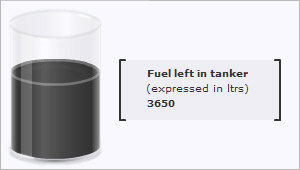
<annotation type='rectangle' xPos='120' yPos='60' toXPos='280' toYPos='120' radius='0' fillcolor='333333' fillAlpha='5'/>
<annotation type='line' xPos='120' yPos='60' toYPos='120' color='333333' thickness='2'/>
<annotation type='line' xPos='280' yPos='60' toYPos='120' color='333333' thickness='2'/>
<annotation type='line' xPos='120' yPos='60' toXPos='125' color='333333' thickness='2'/>
<annotation type='line' xPos='120' yPos='120' toXPos='125' color='333333' thickness='2'/>
<annotation type='line' xPos='275' yPos='60' toXPos='280' color='333333' thickness='2'/>
<annotation type='line' xPos='275' yPos='120' toXPos='280' color='333333' thickness='2'/>
<annotation type='text' label='Fuel left in tanker' font='Verdana' xPos='145' yPos='65' align='left' vAlign='left' fontcolor='333333' fontSize='10' isBold='1'/>
<annotation type='text' label='(expressed in ltrs)' font='Verdana' xPos='144' yPos='80' align='left' vAlign='left' fontcolor='333333' fontSize='10'/>
<annotation type='text' label='3650' font='Verdana' xPos='145' yPos='95' align='left' vAlign='left' fontcolor='333333' fontSize='10' isbold='1'/>
</annotationGroup>
</annotations>
</chart>