Using the dynamic resizing feature of FusionWidgets XT, the annotations in all charts and gauges resize dynamically when the parent containers of the charts and gauges resize. In this page we will discuss the following:
- How to enable the dynamic resizing feature of annotations
- How are the annotations rendered and resized
- How to enable unconstrained scaling in rectangle and line annotations
- How to enable scaling of text
- How to enable scaling of images
- How to keep the annotations aligned with the chart elements while resizing
- How to use dynamically resizable annotations in containers with dynamic dimensions
- Notes for FusionCharts for Flex v1.3 users
How to enable the dynamic resizing feature of annotations
To enable the dynamic resizing feature, do the following:
- Set the chart's or gauge's width and height in percentage
- Set the container's dimensions such that it can resize dynamically (using code or due to user interaction)
- Set the manageResize attribute to 1 in the XML data
<chart manageResize='1' ...>
These make a chart or gauge and all its elements including annotations resize and scale automatically whenever the dimensions of the parent container of the chart/gauge change.
Note: The dynamic resizing feature does not work if autoScale attribute is set to 0. This attribute can be set in the chart or annotations element.
How are the annotations rendered and resized
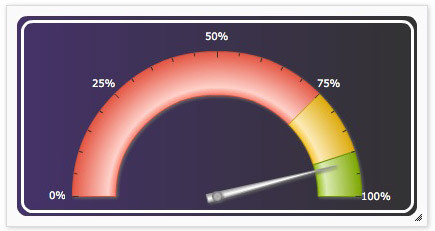
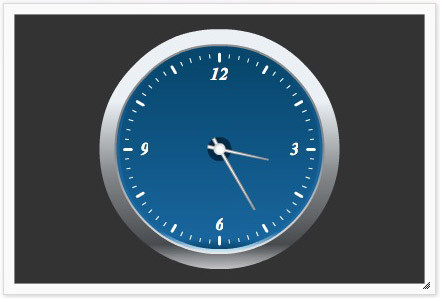
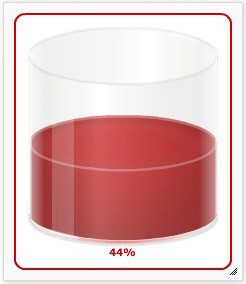
By default, when a chart is rendered initially (before resizing), it draws the annotations based on the coordinates and size provided in the XML. It does not scale the annotations. Shown below a simple gauge (with background created using rectangle annotations) rendered inside a dynamically resizable container.
On resizing (dynamically), the annotation groups and the annotation elements are scaled in the following way:
- The x and y positions of the annotation groups are first re-calculated and scaled.
- Scaling of the x and y positions of the annotation groups is done without maintaining proportions.
- Scaling is not applied on the values passed through the xShift and yShift attributes.
- Scaling is also not applied on the values provided by annotation macros. However, the numeric values (if not prefixed by a $) present in the macro expressions are scaled.
- Scaling is further applied on the position (x, y, toX and toY) and size (radius etc.) of the annotation elements.
- All the annotation elements (rectangle, line, arc, circle, and polygon) are scaled proportionally, that is, preserving the proportions of the shapes to avoid distortion. To maintain proportion, the annotations scale based on the least change between the height and the width.
- You can scale the line and rectangle annotations without maintaining proportions by setting constrainedScale='0'.
- To allow scaling of text and image annotations, you need to set scaleText='1' and scaleImages='1' respectively, in the <annotationGroup> element.
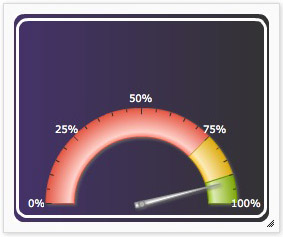
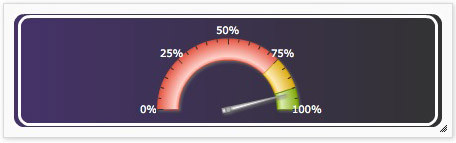
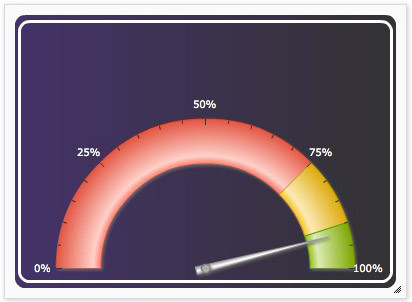
While trying the above sample, you might have noticed that the annotations are not always fitting to the resized space of the gauge. This is deliberately made such in this example to showcase how annotations are scaled and resized in proportions. We will also see how this can be resolved in the next section.
How to enable unconstrained scaling in rectangle and line annotations
While resizing dynamically, all the annotation elements (rectangle, line, arc, circle, and polygon) are primarily scaled proportionally (using constrained scaling), that is, preserving the proportions of the shapes to avoid distortion. To maintain proportion, the annotations scale based on the least change between the height and the width. You can however disproportionately (unconstrained) scale all the line and rectangle annotations by setting the constrainedScale attribute to 0 in the annotations element as shown below:
You can selectively disable constrained scaling in a particular annotation group using:
With the above modification, if you run the previous sample, you will notice that the annotations behind the gauge always fit to the resized dimensions of the gauge. The images below show some of the resized dimensions of the modified sample:
NOTE: To avoid distortion, you cannot apply Unconstrained Scaling on circles, arcs and polygons.
How to enable scaling of text
By default, the text annotations are not scaled during dynamic resizing. You can however, enable scaling of all the text annotations using the scaleText attribute of the annotations element.
The same attribute can also be used with the annotationGroup element to control the scaling of text in an annotation group.
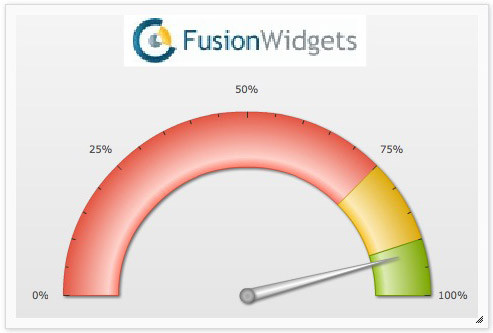
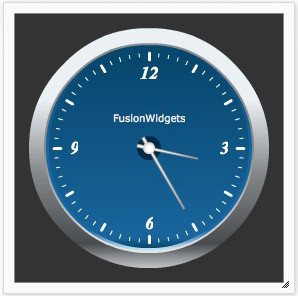
The image below shows "FusionWidgets" as the text annotation in a gauge.
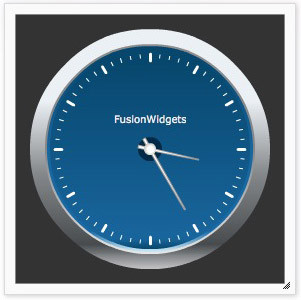
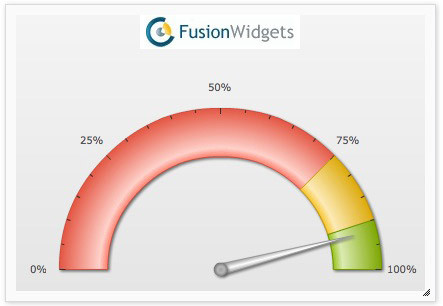
The image below shows how the text annotation is scaled during dynamic resizing:
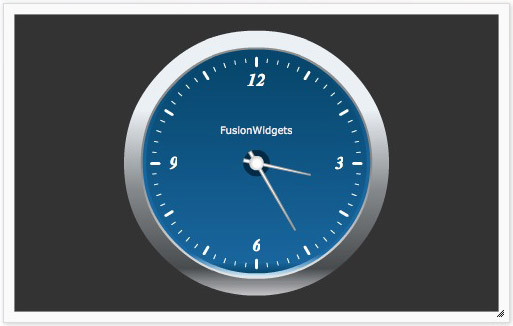
The image below shows how the text annotation is not scaled during dynamic resizing:
Setting scaleText to 0 will imply that the text annotations are not to be scaled.
How to enable scaling of images
While dynamically resizing a chart, the image annotations are not scaled by default. You can however, enable scaling of all the image annotations using the scaleImages attribute of the annotations element.
The same attribute can also be used with the annotationGroup element to control the scaling of images in an annotation group.
The image below shows the FusionWidgets logo as the image annotation in a gauge.
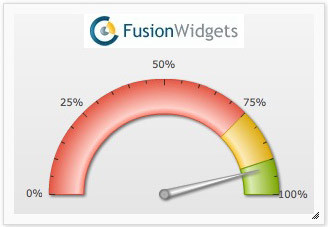
The image below shows how the image annotation is scaled during dynamic resizing:
The image below shows how the image annotation is not scaled during dynamic resizing:
Setting scaleImages to 0 will imply that the image annotations are not to be scaled.
How to keep the annotations aligned with the chart elements while resizing
During dynamic resizing, it is important that the annotations remain aligned with the other visual elements of the chart (like aligning the center of a circle annotation with the center of an angular gauge). Hence, while designing the annotations, it is imperative that you follow a few simple thumb-rules, as stated below:
- Position the annotation groups (using x, y, xShift and yShift attributes) with respect to the other elements of the gauge. For example, align the annotation groups' origins with center of an angular gauge.
- Position an annotation element relative to the position of its annotation group.
- Make proper use of the newly introduced macros for annotations to set dynamic positions to the annotation groups and individual annotation elements.
Let us consider a few examples to illustrate the above mentioned points:
1. Position the annotation groups with respect to the other elements of the gauge
The image below shows an angular gauge with a silver dial around it and a blue background behind it.
The silver dial and the blue background are created using circle annotations. Considering the width and height of the gauge to be 270x270 pixels, 135 is set to both the x and y positions of the circles. The annotations group's x and y positions are not defined.
<annotations>
<!--circles behind the gauge-->
<annotationGroup id="Grp1" showBelow="1">
<annotation type="circle" x="135" y="135" color="EBF0F4,85898C,484C4F,C5C6C8" fillRatio="30,30,30,10" fillAngle="270" radius="120" fillPattern="linear"/>
<annotation type="circle" x="135" y="135" color="8E8E8E,83878A,E7E7E7" fillAngle="270" radius="105" fillPattern="linear"/>
<annotation type="circle" x="135" y="135" color="07476D,19669E,186AA6,D2EAF6" fillRatio="5,45,40,10" fillAngle="270" radius="103" fillPattern="linear"/>
<annotation type="circle" x="135" y="135" color="07476D,19669E,07476D" fillRatio="5,90,5" fillAngle="270" radius="100" fillPattern="linear"/>
</annotationGroup>
<!--Circle behind the pivot-->
<annotationGroup id="Grp2" showBelow="1">
<annotation type="circle" x="135" y="135" radius="12" color="012A46"/>
</annotationGroup>
</annotations>
</chart>
When the container of this gauge is resized disproportionately, the annotations fail to remain aligned to the center of the gauge as shown below:
To take care of this, you can align the x and y positions of the annotation groups to the gauge's center and then re-calculate the center of the circles with respect to the x and y positions of the annotation groups as shown in the code below:
<annotations>
<!--circles behind the gauge-->
<annotationGroup id="Grp1" showBelow="1" x="135" y="135">
<annotation type="circle" x="0" y="0" color="EBF0F4,85898C,484C4F,C5C6C8" fillRatio="30,30,30,10" fillAngle="270" radius="120" fillPattern="linear"/>
<annotation type="circle" x="0" y="0" color="8E8E8E,83878A,E7E7E7" fillAngle="270" radius="105" fillPattern="linear"/>
<annotation type="circle" x="0" y="0" color="07476D,19669E,186AA6,D2EAF6" fillRatio="5,45,40,10" fillAngle="270" radius="103" fillPattern="linear"/>
<annotation type="circle" x="0" y="0" color="07476D,19669E,07476D" fillRatio="5,90,5" fillAngle="270" radius="100" fillPattern="linear"/>
</annotationGroup>
<!--Circle behind the pivot-->
<annotationGroup id="Grp2" x="135" y="135" showBelow="1">
<annotation type="circle" x="0" y="0" radius="12" color="012A46"/>
</annotationGroup>
</annotations>
</chart>
Now, you'll find that the annotations remain aligned with the gauge center while resizing.
2. Position an annotation element relative to the position of its annotation group
The previous example shows how the individual annotation elements (circles) are placed relative to the positions of the annotation groups. In that example the x and y positions of the circles are set to 0. You can further tweak the positions by setting a positive or a negative number. For example, you can add a text annotation 30px above the gauge's center using:
<annotations>
...
<annotationGroup id="Grp2" x="135" y="135" showBelow="1">
... <annotation type='text' color='EBF0F4' label="FusionWidgets" y='-30' />
</annotationGroup>
</annotations>
</chart>
The text is placed above the center of the gauge as shown below (in any resized state):
Macros for annotations help you define smart positions for the annotation groups and the annotation elements. You can edit the above examples and replace the manual values set for the centers of the annotation groups with macros - $chartCenterX and $chartCenterY as shown below:
<annotations>
...
<annotationGroup ... x="$chartCenterX" y="$chartCenterY" ...>
... </annotations>
</chart>
This always places the circles at the center of the gauge, irrespective of the dynamic size of the gauge.
You can also define dynamic borders around a chart using macros. These borders fit to a dynamically resized chart, as shown below:
The borders can be defined easily as shown in the snippet below:
<annotations>
...
<annotationGroup id="border1">
<annotation type="rectangle" x="$chartStartX+1" y="$chartStartY+1" toX="$chartEndX-1" toY="$chartEndY-1" color="FFFFFF" alpha="100" showBorder="1" borderColor="CC0000" borderThickness="2" radius="10"/> </annotationGroup>
</annotations>
</chart>
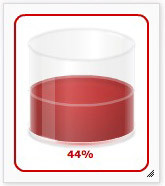
Shown below are a few more examples, where macros are used to create dynamically resizable annotations:
The blue glass gauge with its reflection is created using macros like $gaugeStartX, $gaugeEndX etc.
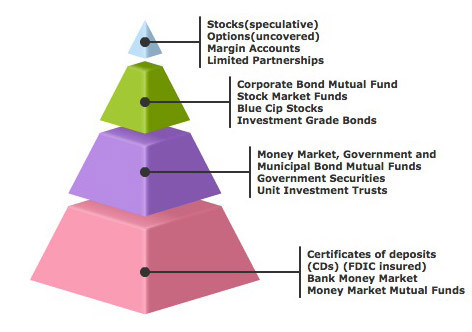
The circles at the center of the pyramid are created using the $canvasCenterX macro.
Using dynamically resizable annotations and charts containers with dynamic dimensions
Mostly, while designing annotation elements, you may set values to the radius and other coordinates of the annotations based on a specific width and height of the chart. We name these dimensions as the original width and the original height of the chart.
By default, when a chart is rendered initially (before resizing), it draws the annotations based on the coordinates and size provided in the XML. It does not scale the annotations on initial render. When this chart is resized, it scales these values or coordinates based on the dimensions of the initially rendered gauge, that is, the width and height of the chart when rendered for the first time. Hence, the annotations will scale perfectly when the initial width and height of the chart are same as the original width and height of the chart.
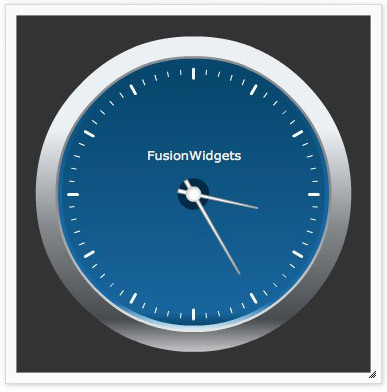
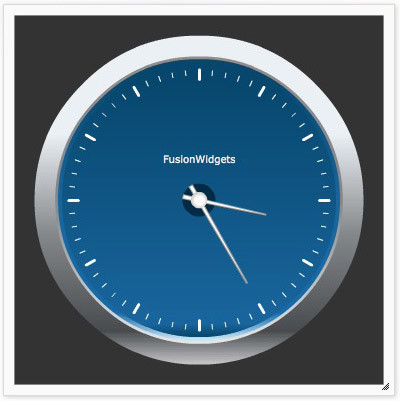
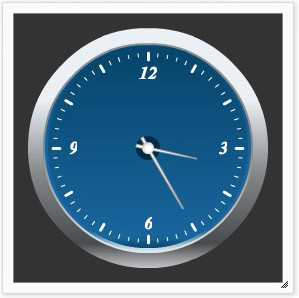
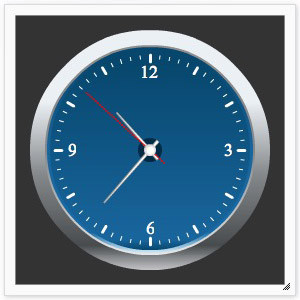
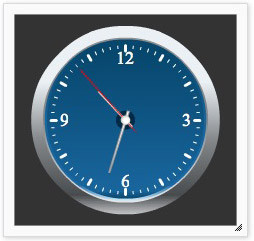
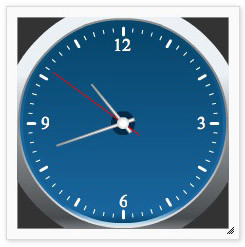
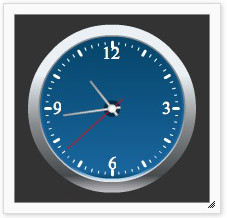
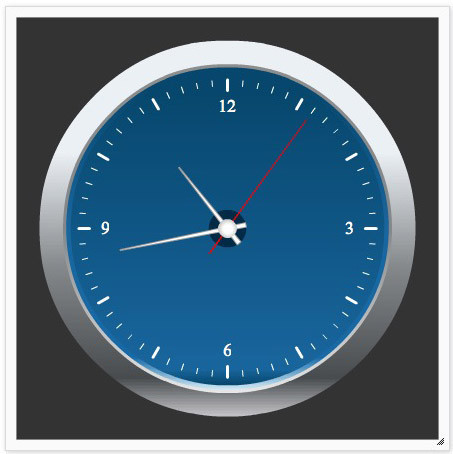
Click here to see an example to showcase this. It shows a dynamically resizable clock whose annotations (the blue background and the silver border around the clock) are designed based on the original width of 270x and original height of 270px. The clock is initially rendered using the same dimensions. When you resize the clock (dragging the corners of the borders around the clock) you will notice that all the annotations (along with the clock) resize and fit properly into the resized space. The images below show how the clock appears in various sizes.
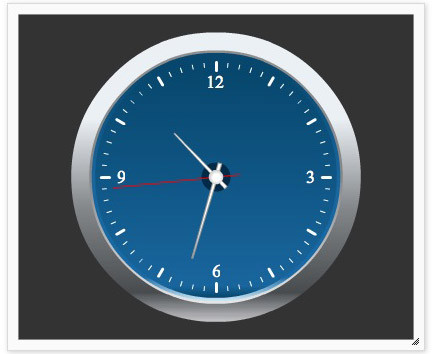
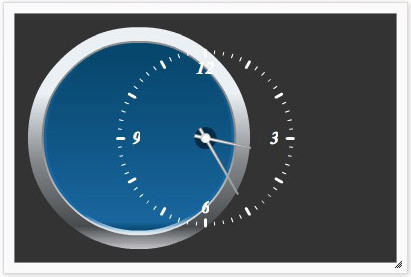
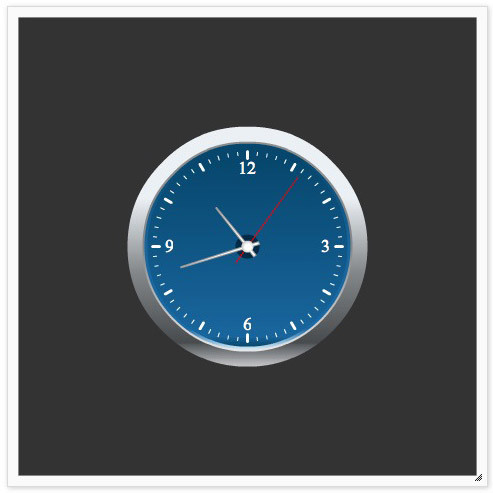
The same clock will, however, not render properly if the initial dimensions of the clock is not same as the original width and height. The clock may appear cropped or with lots of empty spaces all around as shown in the images below:
This scenario is apparent in applications having containers with dynamic dimensions like web parts, panels etc. These containers are not set with fixed dimensions. Rather, they derive their dimensions based on various conditions like available space, number of columns and rows etc.
To take care of this situation, you need to pass the original width and height (based on which you had designed the annotations) to the chart. On receiving the original width and height, the chart always checks the current dimensions against the original width and height then scales everything accordingly.
You can pass the original width through the origW attribute and original height through the origH attribute of the of the chart element.
The same attribute can also be used with the annotations element.
Let us check the modified XML data for the clock:
<dials>
<dial value="5" color="FFFFFF" baseWidth="3" topWidth="1" radius="70" rearExtension="12"/>
</dials>
<annotations>
<annotationGroup id="Grp1" showBelow="1" x="$chartCenterX" y="$chartCenterY">
<annotation type="circle" color="EBF0F4,85898C,484C4F,C5C6C8" fillRatio="30,30,30,10" fillAngle="270" radius="120" fillPattern="linear"/>
<annotation type="circle" color="8E8E8E,83878A,E7E7E7" fillAngle="270" radius="105" fillPattern="linear"/>
<annotation type="circle" color="07476D,19669E,186AA6,D2EAF6" fillRatio="5,45,40,10" fillAngle="270" radius="103" fillPattern="linear"/>
<annotation type="circle" color="07476D,19669E,07476D" fillRatio="5,90,5" fillAngle="270" radius="100" fillPattern="linear"/>
</annotationGroup>
<annotationGroup id="Grp2" showBelow="1" x="$chartCenterX" y="$chartCenterY">
<annotation type="circle" radius="12" color="012A46"/>
</annotationGroup>
</annotations>
</chart>
When you run the modified sample, you will notice that the annotations (along with the clock) now fit proportionately to any given initial dimensions.
Note for users of FusionCharts for Flex 1.2 or earlier:
If you are already using the Auto Scale feature of FusionWidgets of FusionCharts for Flex v1.2 (setting autoScale='1' in the <chart>, <annotations> or <annotationGroup> element) to auto-scale annotations, you can continue to use it in FusionWidgets XT without facing any problem.
However, if you want to use the dynamic resizing feature and macros introduced in FusionWidgets XT, you can set manageResize='1'. Also, please note that you may require to tweak your existing annotations to make them work (without getting distorted) in dynamically resizable charts. While tweaking, please remember the following:
- Position the annotation groups (using x, y, xShift and yShift attributes) with respect to the other elements of the gauge. For example, align the annotation groups' origins with center of an angular gauge.
- Position an annotation element relative to the position of its annotation group.
- Make proper use of the newly introduced macros for annotations to set dynamic positions to the annotation groups and individual annotation elements.
- Unconstrained scaling on circle, arc and polygons will not be applied while using the dynamic resizing feature.