Debug Mode (Window)
FusionCharts/FusionWidgets debug mode gives you an insight into the complex process that goes into rendering a chart. The debug mode can also assist you in tracking errors. With the help of the debug mode you can easily track following errors:
- Error in loading data - reasons
- No data to display - possible reasons
- Invalid XML data - 10 possible reasons
- If invalid style names are specified for Chart OBJECTS
- If invalid macros are used for animations using STYLE
- And a few more...
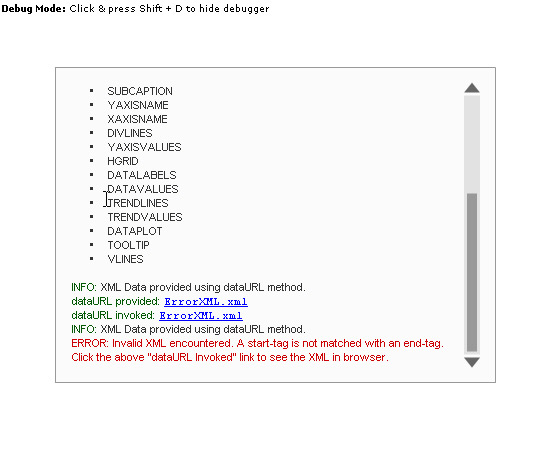
To activate the debug mode of a chart – just set the FCDebugMode attribute of FusionCharts/FusionWidgets component to true. Following is an image of the debug window of a chart, which has loaded successfully using FCDataURL method.
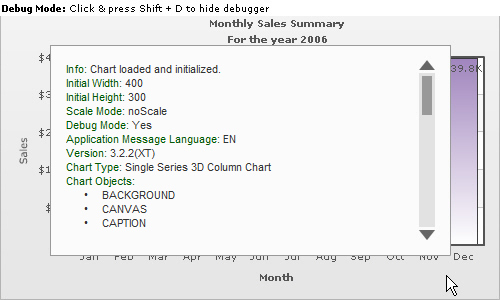
Info: Chart loaded and initialized.
Initial Width: 500
Initial Height: 300
Scale Mode: noScale
Debug Mode: Yes
Application Message Language: EN
Version: 3.2.2(XT)
Chart Type: Single Series 2D Column Chart
Chart Objects:
- BACKGROUND
- CANVAS
- CAPTION
- SUBCAPTION
- YAXISNAME
- XAXISNAME
- DIVLINES
- YAXISVALUES
- HGRID
- DATALABELS
- DATAVALUES
- TRENDLINES
- TRENDVALUES
- DATAPLOT
- TOOLTIP
- VLINES
INFO: XML Data provided using dataURL method.
dataURL provided: Data.xml
dataURL invoked: Data.xml
XML Data: <chart caption="Monthly Sales Summary" subcaption="For
the year 2006" xAxisName="Month" yAxisName="Sales"
numberPrefix="$"><set label="Jan" value="17400"
/><set label="Feb" value="19800" /><set
label="Mar" value="21800" /><set label="Apr"
value="23800" /><set label="May" value="29600"
/><set label="Jun" value="27600" /><set
label="Jul" value="31800" /><set label="Aug"
value="39700" /><set label="Sep" value="37800"
/><set label="Oct" value="21900" /><set
label="Nov" value="32900" /><set label="Dec"
value="39800" /></chart>
The Debug Window provides following vital information about the chart:
- A message indicating whether or not, the chart/widget has loaded and initialized properly.
- Specified width and height.
- Scale Mode, Debug Mode, Application Message Language.
- Chart Version - Which version of chart you're using.
Charts show 3.2.2(XT) and widgets show 3.2 (XT) as the version in FusionCharts for Flex v1.3.
- Chart Type that you're using - What type of chart you are using. Single Series 2D Column Chart in this example.
- Objects supported by the chart - This helps you quickly refer to a chart object without going through individual Chart XML Sheets.
- Method using which, XML data was provided to the the chart - Can be FCDataURL or FCDataXML.
- If FCDataURL method is used, then the link to original FCDataURL and also to the invoked one will be displayed. There could be a difference between the two. If your FCdataURL is URL-encoded - FusionCharts converts it into normal form before invoking it. If you get an error in loading the data, you can can check the Debug Window to see whether the right URL is being invoked. You can also click on the URL to open the page in a browser to find if any errors thrown by your server side scripting language.
- The XML data is also displayed in the Debug Window.
To bring the chart to the foreground – click on the chart and then press Shift + D. You can use Shift + D to switch back to the debug mode.
<mx:Application xmlns:mx="http://www.adobe.com/2006/mxml" layout="absolute" xmlns:ns1="com.fusioncharts.components.*">
<ns1:FusionCharts x="30" y="24" FCChartType="Column2D" FCDataURL="data.xml" FCDebugMode="true"/>
</mx:Application>
<s:Application xmlns:fx="http://ns.adobe.com/mxml/2009" xmlns:s="library://ns.adobe.com/flex/spark" xmlns:mx="library://ns.adobe.com/flex/mx" minWidth="955" minHeight="600" xmlns:components="com.fusioncharts.components.*">
<components:FusionCharts x="30" y="24" FCChartType="Column2D" FCDataURL="data.xml" FCDebugMode="true"/>
</s:Application>