FusionCharts for Flex > Special Cases > Using Flash CS3/CS4/CS5
FusionCharts for Flex v1.3 provides a Flash SWC component (FusionChartsComponent.swc) to render charts and gauges from FusionCharts for Flex pack in Flash CS3/CS4/CS5 applications. In this page we will create a simple sales chart using Flash CS5 (steps are same for Flash CS3 or Flash CS4).
Note: You need to install FusionChartsComponent before proceeding with this section. For information regarding installation see the Flash CS3/CS4/CS5 Integration page.
Setting up
We will consider that you have already followed the installation steps, installed FusionChartsComponent and copied com, fusioncharts and fusionwidgets folders in the folder where you have saved your Flash document.
Simple Sales data
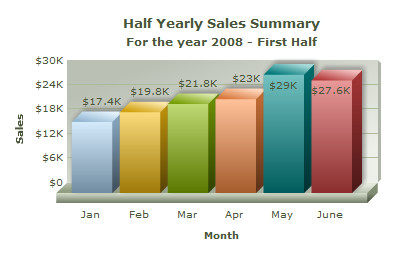
For this example we'll be plotting half yearly sales summary for a given year, say 2008. The data to be used is displayed in the table (below). We will create a Column 3D chart for presenting the data.
| Month | Sales(2008) |
|---|---|
| January | $17400 |
| February | $19800 |
| March | $21800 |
| April | $23000 |
| May | $29000 |
| June | $27600 |
FusionCharts for Flex internally takes in data only in custom XML format. So, we need to convert the data into XML.
To know more about FusionCharts XML, please go through the FusionCharts and XML > Chart XML Reference section.
The converted XML data is shown below:
<chart caption='Half Yearly Sales Summary' subcaption='For the year 2008 - First Half'
   xAxisName='Month' yAxisName='Sales' numberPrefix='$'>
	<set label='Jan' value='17400' />
	<set label='Feb' value='19800' />
	<set label='Mar' value='21800' />
	<set label='Apr' value='23000' />
	<set label='May' value='29000' />
	<set label='June' value='27600' />
</chart>
Punch the above code (you can even copy paste the XML code) into a text editor (e.g., Notepad) and save it as SalesData.xml inside the folder where you saved the Flash document.
Building the Chart
Once ready with the installation and the sales data, copy the code given below and paste it in the Action window.
//import the FusionCharts Loader class...
import com.fusioncharts.components.*;
import com.events.FCEvent;

/*
 * In this sample we will create a charts showing
 * half yearly sales data. The first chart is a Column
 * chart showing sales figures in columns.
*/
//instantiate FusionCharts class
var ColumnSalesSummary:FusionCharts = new FusionCharts();

// set chart type to column
ColumnSalesSummary.FCChartType = "Column3D";

//Load data
ColumnSalesSummary.FCDataURL = "SalesData.xml";

//Set width, height
ColumnSalesSummary.width = 400;
ColumnSalesSummary.height = 250;

//Set chart position
ColumnSalesSummary.x = 25;
ColumnSalesSummary.y = 50;

// add chart to stage and display it
this.addChild(ColumnSalesSummary);
The above code will generate a Column 3D chart showing the sales data as shown below:
Important Checklist:
1. While running the Flash application (SWF file), you must keep a copy of idSetter.swf file inside com\idsetter folder and put the com folder in the same folder from where the Flash application is running.
2. Keep a copy of fusioncharts and fusionwidgets folders in the sample folder from where the Flash application is running.