In this section, we will discuss the process to configure the tick. Here, we'll see how to:
- Show/hide tick marks and tick values
- Configure tick values
- Configure tick marks & values position
- Configure number of major and minor tick marks
- Configure cosmetics
- Configure tick mark & tick value padding
Let's see how to perform each of the following tasks stated above.
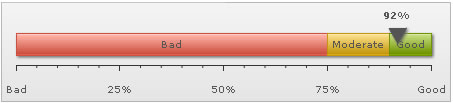
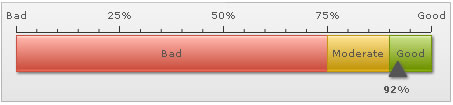
To hide both the tick marks and tick values, set:
<chart ... showTickMarks='0' showTickValues='0' ...>
This will result in:
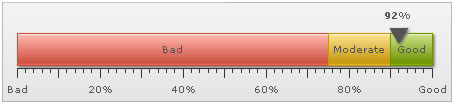
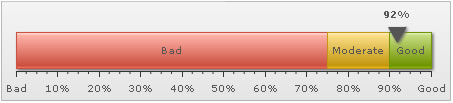
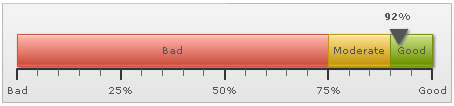
To show every nth tick values, set:
<chart ... tickValueStep='2' ...>
This will result in every 2nd major tick mark's value as shown below:
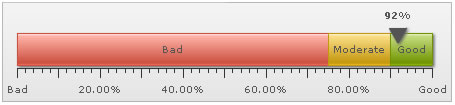
To set the decimals for the tick values, set:
<chart ... tickValueDecimals='2' forceTickValueDecimals='1' ..>
Here, we've set tick value decimals as 2 and forced them to display. It will result in:
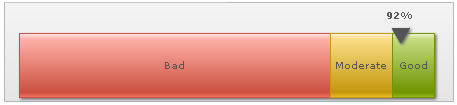
To configure the ticks to show above/below the gauge, set:
<chart ... ticksBelowGauge='0' ...>
This will result in:
Additionally, you can opt to place the ticks/values inside/outside. For this, set:
<chart ... placeTicksInside='1' placeValuesInside='1' ...>
To configure the number of tick marks, set:
<chart ... majorTMNumber='12' minorTMNumber='3' ...>
It will result in:
As you can see above, the chart has automatically adjusted the number of major ticks to a best feasible value. However, if you do not want the chart to perform the same, you need to add:
<chart ... adjustTM='0' majorTMNumber='12' minorTMNumber='3' ...>
To configure tick mark cosmetics, set:
<chart ... majorTMColor='333333' majorTMAlpha='100' majorTMHeight='10' majorTMThickness='2' minorTMColor='666666' minorTMAlpha='100' minorTMHeight='7' minorTMThickness='1' ...>
This will result in:
You can set tick mark and tick value padding. For this, set:
<chart ... tickMarkDistance='10' tickValueDistance='10' ...>
This will result in: