You can easily implement FusionCharts drilldown functionality directly from your Flex application. FusionCharts for Flex provides the following two processes through which you can imbibe drilldown functionality in charts. The two processes are:
- Trapping FCClickEvent
- Calling a function defined in Flex.
<set label='Hong Kong' value='235' link="S-Week 4"/>
private var data:ArrayCollection=new ArrayCollection([
{label:'Week 4',value:'48',link:'S-Week 4'}
]);
private var chartData:XML=
<main>
<data>
<data label='Jan' value='17400' link='S-Week 4' />
</data>
</main>
<chart>
<data>
<label>Jan</label>
<value>17400</value>
<link>S-Week 4</link>
</data>
</chart>
</mx:Model>
In the above code, my_func is a function defined in a Flex project. The function is invoked when a data plot (column, pie, bar etc.) is clicked, and the values of the label and value attribute pertaining to that data plot will be passed as parameters. You can even pass identifier numbers or strings to each data as parameters to the function.
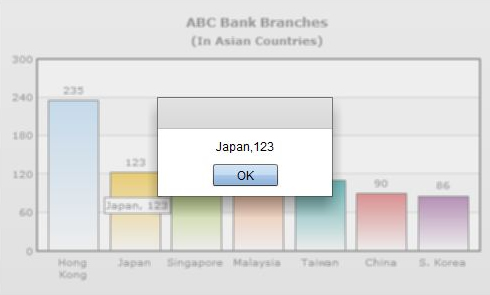
Let's make an example chart to demonstrate Flex function call thtough a link. We'll create a simple 2D Column chart to display number of branches that ABC bank has in various Asian countries. When a column is clicked a message box is displayed, showing values of label and value attributes pertaining to the clicked data plot.
Here's the code:
<?xml version="1.0" encoding="utf-8"?>
<s:Application xmlns:fx="http://ns.adobe.com/mxml/2009" xmlns:s="library://ns.adobe.com/flex/spark" xmlns:mx="library://ns.adobe.com/flex/mx"
   xmlns:components="com.fusioncharts.components.*">

  <components:FusionCharts id="myChart" FCChartType="Column2D"  width="500" height="300" FCDataURL="Data.xml" />

  <fx:Script>
    <![CDATA[

         import mx.controls.Alert;

         // This function will be invoked upon click in a particular data element.
         // The function name and parameters are specified on the chart data or in
         // the XML file as link attribute and starts with 'E-'

         public function my_func(linkParam:String):void
         {
           Alert.show(linkParam);
         }
    ]]>
   </fx:Script>
</s:Application>
<set label='Hong Kong' value='235' link='E-my_func,Hong Kong,235'/>
<set label='Japan' value='123' link='E-my_func,Japan,123'/>
<set label='Singapore' value='129' link='E-my_func,Singapore,129'/>
<set label='Malaysia' value='121' link='E-my_func,Malayasia,121'/>
<set label='Taiwan' value='110' link='E-my_func,Taiwan, 110'/>
<set label='China' value='90' link='E-my_func,China, 90'/>
<set label='S. Korea' value='86' link='E-my_func,S. Korea, 86'/>
</chart>
By default, FusionCharts for Flex calls the Flex functions from the Global scope. However, if you wish to define the functions inside an object, you need to specify the reference to that object through the FCFlexFunctionsObject property. Let's modify the above example to demonstrate this:<?xml version="1.0" encoding="utf-8"?> <s:Application xmlns:fx="http://ns.adobe.com/mxml/2009" xmlns:s="library://ns.adobe.com/flex/spark" xmlns:mx="library://ns.adobe.com/flex/mx" xmlns:components="com.fusioncharts.components.*" initialize="init()"> <components:FusionCharts id="myChart" FCChartType="Column2D" width="500" height="300" FCDataURL="Data.xml" /> <mx:Script> <![CDATA[ // Declare a myFunctions object public var myFunctionsObj:myFunctions; public function init():void { // instantiate myFunctionsObj myFunctionsObj = new myFunctions(); // assign myFunctionsObj to chart myChart.FCFlexFunctionsObject = myFunctionsObj; } ]]> </mx:Script> </mx:Application>The code of the myFunction class is:
package
{
    // This class contains the functions which will be called from
    // the Flex function links defined in the chart data

    internal class myFunctions
    {

        import mx.controls.Alert;

        // This function will be invoked upon click in a particular data element.
        // The function name and parameters are specified on the chart data or in
        // the XML file as link attribute and starts with 'E-'

        public function my_func(linkParam:String):void
        {
            Alert.show(linkParam);
        }

        public function myFunctions(){ }

    }
}
In the above code, we put my_func in a class named myFunctions and instantiated the class as an object named myFunctionsObj. We assign this object as the Flex function handler object through FCFlexFunctionsObject = myFunctionsObj. This makes the chart call the Flex function from the myFunctionsObj object when a link with E- prefix is invoked.
private var chartData:ArrayCollection=new ArrayCollection([
{ label:'Jan', value:'17400', link:'E-my_func,Hong Kong,235'}
]);
private var chartData:XML=
<main>
<data>
<data label='Jan' value='17400' link:'E-my_func,Hong Kong,235'/>
</data>
</main>;
<chart>
<data>
<label>Jan</label>
<value>17400</value>
<link>E-my_func,Hong Kong,235</link>
</data>
</chart>
</mx:Model>