|
|
| We can change the Title and Axis Names of the charts through chartParams attribute of FusionCharts Querystring. |
| |
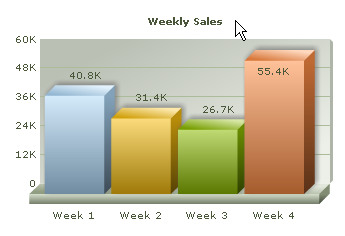
| We can change the Title of the charts using caption and subcaption parameters in the chartParams attribute. Let's take an example. |
| |
| We provide a caption to out chart. |
?v=3&chart=[chartType=column3D;chartWidth=350;chartHeight=240]
&chartParams=[bgColor=FFFFFF;caption=Weekly Sales]
&labels=Week 1;Week 2;Week 3;Week 4
&data=40800;31400;26700;55400 |
| |
 |
| |
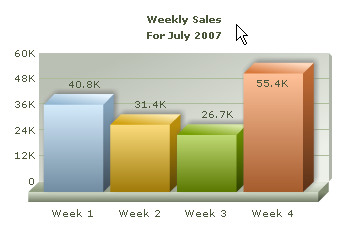
| We can add Subtitle using subCaption parameter in the chartParams attribute. Let's see how it can be achieved: |
| |
?v=3&chart=[chartType=column3D;chartWidth=350;chartHeight=240]
&chartParams=[bgColor=FFFFFF;caption=Weekly Sales;subCaption=For July 2007]
&labels=Week 1;Week 2;Week 3;Week 4
&data=40800;31400;26700;55400 |
| |
 |
| |
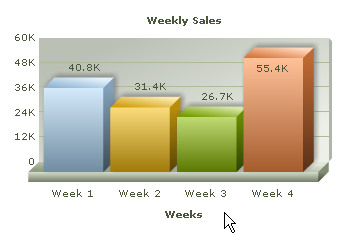
| To display Axis Names to specify the items associated with an axis we will use xAxisName and yAxisName parameters of chartParams attribute. Let's take few examples. |
| |
| X-Axis Name |
| We are adding xAxisName parameter to chartParams attribute to add X-Axis Name. |
| |
?v=3&chart=[chartType=column3D;chartWidth=350;chartHeight=240]
&chartParams=[bgColor=FFFFFF;caption=Weekly Sales;xAxisName=Weeks]
&labels=Week 1;Week 2;Week 3;Week 4
&data=40800;31400;26700;55400 |
| |
 |
| |
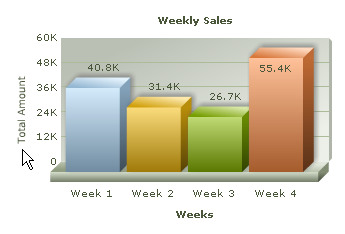
| Y-Axis Name |
| We are adding yAxisName parameter to chartParams attribute to add X-Axis Name. |
| |
?v=3&chart=[chartType=column3D;chartWidth=350;chartHeight=240]
&chartParams=
[bgColor=FFFFFF;caption=Weekly Sales;xAxisName=Weeks;yAxisName=Total Amount]
&labels=Week 1;Week 2;Week 3;Week 4
&data=40800;31400;26700;55400 |
 |
| |
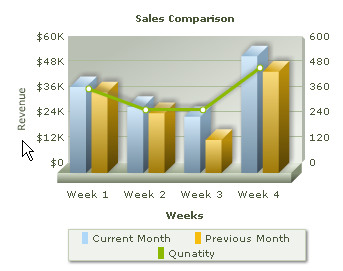
| In combination charts we deal with two Y Axes. FusionCharts for FileMaker allows us to assign suitable tag to both Primary and Secondary Y Axis using PYAxisName and SYAxisName parameters respectively of chartParams attribute. Let's try two examples for better understanding. |
| |
| Primary Y-Axis Name |
| |
?v=3&chart=[chartType=column3dlinedy;chartWidth=350;chartHeight=280]
&chartParams=
[caption=Sales Comparison;xAxisName=Weeks;pYAxisName=Revenue;showvalues=0;numberPrefix=$]
&labels=Week 1;Week 2;Week 3;Week 4
&data=[seriesName=Current Month;numberPrefix=$]40800;31400;26700;55400
&data=[seriesName=Previous Month;numberPrefix=$]38300;28400;15700;48100 &data=[SeriesName=Qunatity;parentYaxis=s]400;300;300;500 |
| |
 |
| |
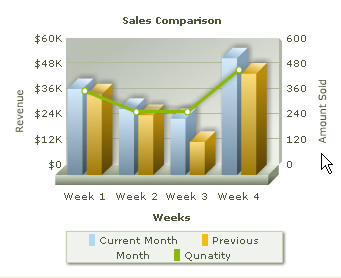
| Secondary Y-Axis Name |
| |
?v=3&chart=[chartType=column3dlinedy;chartWidth=350;chartHeight=280]
&chartParams=
[caption=Sales Comparison;xAxisName=Weeks;pYAxisName=Revenue;sYAxisName=Amount Sold;
showvalues=0;numberPrefix=$]
&labels=Week 1;Week 2;Week 3;Week 4
&data=[seriesName=Current Month;numberPrefix=$]40800;31400;26700;55400
&data=[seriesName=Previous Month;numberPrefix=$]38300;28400;15700;48100 &data=[SeriesName=Qunatity;parentYaxis=s]400;300;300;500 |
| |
 |
| |
Note: yAxisName parameter does not respond in case of Combination Chart as it has two Y-Axes. pYAxisName and sYAxisName parameters should be used to assign name to Y-Axis in Combination Chart.
Please go to Common Parameters > Functional Parameters section for Axes Name Display related parameters. |
| |