In this section, we will show you how to use FusionCharts XT and ASP.NET to plot charts from data contained in a database. Here, we will do the following:
- Create a pie chart to show "Production by Factory" by initially using the Data String method
- Convert the chart to use the Data URL method
- Create a multi-series line chart from database
For the sake of ease, we will use an Access Database. The database is present in Download Package > Code > VB_NET > DB folder. You can, however, use any database with FusionCharts including MS SQL, Oracle, MySQL, etc.
Before you go further with this page, we recommend you to please see the previous section, Basic Examples, as we start off from concepts explained in that page.
The code examples contained in this page are present in Download Package > Code > VB_NET > DBExample folder. The Access database is present in Download Package > Code > VB_NET > DB.
Before we code the ASP.NET pages to retrieve data, let's quickly have a look at the database structure.
The database contains just two tables:
- Factory_Master: To store the name and id of each factory
- Factory_Output: To store the number of units produced by each factory for a given date.
For demonstration, we have fed some dummy data in the database. Let's now shift our attention to the ASP.NET page that will interact with the database, fetch data and then render a chart.
The ASP.NET page for Data String method example is named as BasicDBExample.aspx (in DBExample folder). It contains the following code (GetFactorySummaryChartHtml() method from code behind page also reproduced below):
<%@ Page Language="VB" AutoEventWireup="false" CodeFile="BasicDBExample.aspx.vb"     Inherits="DBExample_BasicDBExample" %>
   <HTML>
   <HEAD>
      <TITLE>FusionCharts XT - Database Example </TITLE>
      <SCRIPT LANGUAGE="Javascript" SRC="../FusionCharts/FusionCharts.js"></SCRIPT>
   </HEAD>
   <body>
     <form id='form1' name='form1' method='post' runat="server">
       <%=GetFactorySummaryChartHtml()%>
     </form>
   </body>
</HTML>
Code Behind page:
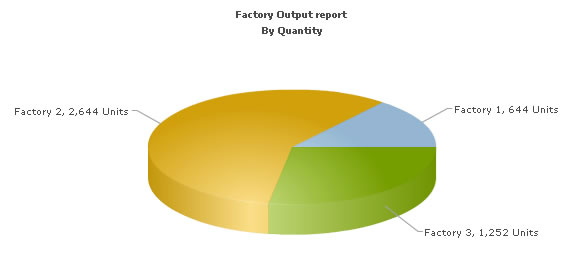
Imports InfoSoftGlobal
Imports System.Text
Imports DataConnection

Partial Class DBExample_BasicDBExample
    Inherits System.Web.UI.Page
    Public Function GetFactorySummaryChartHtml() As String
        'In this example, we show how to connect FusionCharts to a database.
        'For the sake of ease, we have used an Access database which is present in
        '../DB/FactoryDB.mdb. It just contains two tables, which are linked to each
        'other.
        'xmlData will be used to store the entire XML document generated
        Dim xmlData As New StringBuilder()

        'Generate the chart element
        xmlData.Append("<chart caption='Factory Output report' subCaption='By Quantity' pieSliceDepth='30' showBorder='1' formatNumberScale='0' numberSuffix=' Units'>")

        'create recordset to get details for the factories
        Dim factoryQuery As String = "select a.FactoryId, a.FactoryName, sum(b.Quantity) as TotQ from .Factory_Master a, Factory_Output b where a.FactoryId=b.FactoryID group by a.FactoryId, a.FactoryName"

        'Create new data connection
        Dim oRs As New DbConn(factoryQuery)

        'Iterate through each record
        While oRs.ReadData.Read()
            'Generate <set label='..' value='..' />
            xmlData.Append("<set label='" & oRs.ReadData("FactoryName").ToString() & "' value='" & oRs.ReadData("TotQ").ToString & "' />")
        End While

        'Close data connection
        oRs.ReadData.Close()

        'Close chart element
        xmlData = (xmlData &"</chart>")

        'Create the chart - Pie 3D Chart with data from xmlData
        Return
	InfoSoftGlobal.FusionCharts.RenderChart("../FusionCharts/Pie3D.swf", "",
	xmlData, "FactorySum", "600", "300", False, False)

End Function
End Class
The following actions are taking place in this code:
- We first include DataConnection and InfoSoftGlobal namespace. DataConnection contains the connection parameters to connect to database.
- Next, we include FusionCharts.js JavaScript class to enable easy embedding of FusionCharts and call the GetFactorySummaryChartHtml() method contained in code behind page.
- In the GetFactorySummaryChartHtml() function, we then open a connection to database and retrieve the data as per the SQL passed.
- Thereafter, we generate the XML data document by iterating through the recordset and store it in xmlData variable.
- Finally, we render the chart using the FusionCharts.RenderChart() method and pass xmlData as Data String.
When you now run the code, you will get an output as under:
Let's now convert this example to use Data URL method. As previously explained, in the Data URL mode, you need two pages:
- Chart Container Page - The page which embeds the HTML code to render the chart. This page also tells the chart where to load the data from. We will name this page as Default.aspx.
- Data Provider Page - This page provides the XML data to the chart. We will name this page as PieData.aspx.
The pages in this example are contained in Download Package > Code > VB_NET > DB_dataURL folder.
Default.aspx contains the following code (with code behind page) to render the chart:
<%@ Page Language="VB" AutoEventWireup="false" CodeFile="Default.aspx.vb" Inherits="DB_dataURL_Default" %>
<HTML>
<HEAD>
<TITLE>FusionCharts XT - Data URL and Database Example
</TITLE>
  <SCRIPT LANGUAGE="Javascript"
  SRC="../FusionCharts/FusionCharts.js"></SCRIPT>
</HEAD>
<body>
<form id='form1' name='form1' method='post' runat="server">
<%=GetQuantityChartHtml()%>
</form>
</body>
</HTML>
Public Function GetQuantityChartHtml() As String
 'In this example, we show how to connect FusionCharts to a database
 'using the Data URL method. In our other examples, we have used the  Data String method
 'where the XML is generated in the same page as chart. Here, the XML data
 'for the chart will be generated in PieData.aspx.
 'To illustrate how to pass additional data as querystring to dataURL,
 'we have added an animate property, which will be passed to PieData.aspx.
 'PieData.aspx will handle this animate property and then generate the
 'XML accordingly.
 'For the sake of ease, we have used an Access database which is present in
 '../DB/FactoryDB.mdb. It just contains two tables, which are linked to each
 'other.
 'Variable to contain dataURL
 'Set DataURL with animation property to 1
 'NOTE: It's necessary to encode the dataURL if you have added parameters to it
		Dim dataURL As String =
		Server.UrlEncode("PieData.aspx?animate=1")
		'Create the chart - Pie 3D Chart with dataURL as strDataURL
		Return FusionCharts.RenderChart("../FusionCharts/Pie3D.swf", dataURL, "", "FactorySum", "600", "300", False, False)
End Function
In the above code, we are:
- Including FusionCharts.js JavaScript class
- Creating the dataURL string and store it in dataURL variable. We append a dummy property - animate to show how to pass parameters to dataURL. After building the dataURL, we encode it using Server.UrlEncode function.
- Finally, rendering the chart using RenderChart() method and set dataURL variable as charts's dataURL.
PieData.aspx contains the following code to output XML Data:
Imports DataConnection
Imports System.Text
Partial Class DB_dataURL_PieData
Inherits System.Web.UI.Page

Private Sub Page_Load(ByVal sender As Object, ByVal e As System.EventArgs) Handles Me.Load
'This page generates the XML data for the Pie Chart contained in
'Default.aspx.
'For the sake of ease, we have used an Access database which is
present in
'../DB/FactoryDB.mdb. It just contains two tables, which are linked to each other.

'xmlData will be used to store the entire XML document generated
Dim xmlData As New StringBuilder()
'Default.aspx has passed us a property animate. We request that.
Dim animateChart As String
animateChart = Request("animate")
'Set default value of 1
If ((Not (animateChart) Is Nothing) AndAlso (animateChart.Length = 0)) Then

animateChart = "1"
End If

'Create the recordset to retrieve data
'Generate the chart element
xmlData.Append("<chart caption='Factory Output report' subCaption='By Quantity' pieSliceDepth='30' showBorder='1' formatNumberScale='0' numberSuffix=' Units' animation='" & animateChart & "'>")

'create recordset to get details for the factories
Dim factoryQuery As String = "select a.FactoryId, a.FactoryName, sum(b.Quantity) as TotQ from .Factory_Master a, Factory_Output b where a.FactoryId=b.FactoryID group by a.FactoryId, a.FactoryName"
Dim oRs As New DbConn(factoryQuery)

 'Iterate through each factory
While oRs.ReadData.Read()
'Generate <set label='..' value='..' />
xmlData.Append("<set label='" & oRs.ReadData("FactoryName").ToString() & "' value='" & oRs.ReadData("TotQ").ToString & "' />")
End While

oRs.ReadData.Close()

'Finally, close <chart> element
xmlData = (xmlData + "</chart>")

'Set Proper output content-type
Response.ContentType = "text/xml"
'Just write out the XML data
'NOTE THAT THIS PAGE DOESN'T CONTAIN ANY HTML TAG, WHATSOEVER
 Response.Write(xmlData)

End Sub
In the above page, we have:
- Requested the animate property which has been passed to it (from dataURL)
- Generated the data and store it in xmlData variable
- Written this data to output stream without any HTML tags.
When you view this page, you'll get the same output as before.
Let's now see how we can create a multi-series chart from database. This is no different from creating the Pie chart we saw above.
All you need to do is to build proper XML from the database that you query from your database. Multi-series charts have a different data format from the format of an XML for a single-series chart like pie. Let us see how the code will look for this:
<%@ Page Language="VB" AutoEventWireup="false" CodeFile="MSCharts.aspx.vb" Inherits="DBExample_MSCharts" %>
<HTML>
  <HEAD>
    <TITLE>FusionCharts XT - Database Example </TITLE>
    <SCRIPT LANGUAGE="Javascript" SRC="../FusionCharts/FusionCharts.js"></SCRIPT>
  </HEAD>
  <body>
    <form id='form1' name='form1' method='post' runat="server">
      <asp:Literal ID="Literal1" runat="server"></asp:Literal>
    </form>
  </body>
</HTML>
Code Behind page:
Public Function mschartsconnection() As String
'In this example, we show how to connect multi-series FusionCharts to a database.
'For the sake of ease, we have used an Access database which is present in
'../App_Data/FactoryDB.mdb. It just contains two tables, which are linked to each
'other.
'xmlData will be used to store the entire XML document generated

Dim xmlData As New StringBuilder()
'Generate the chart element
xmlData.Append("<chart caption='Factory Output report' subCaption='By Quantity' showBorder='1' formatNumberScale='0' rotatelabels='1' showvalues='0'>")
xmlData.Append("<categories>")
'create recordset to get details for the factory id

'create recordset to get details for the datepro
Dim factoryQuery As String = "select distinct format(datepro,'dd/mm/yyyy') as dd from factory_output"
Dim oRs As New DbConn(factoryQuery)

'Iterate through each record
While oRs.ReadData.Read
'Generate the category labels
xmlData.Append("<category label='" & oRs.ReadData("dd").ToString() & "'/>")
End While
oRs.ReadData.Close()

'Close categories element
xmlData.Append("</categories>")
'oRs4.ReadData.Close()

'Create recordset to create details for factory names from the master table
Dim factoryQuery2 As String = "select * from factory_master"
Dim oRs1 As New DbConn(factoryQuery2)

'Iterate through each record
While oRs1.ReadData.Read()

'Generate the <dataset seriesname='..'>
xmlData.Append("<dataset seriesName='" & oRs1.ReadData("factoryname").ToString() & "'>")
'Create recordset to get the details of the quantity from the factory_output table
Dim factoryQuery3 As String = "select quantity from factory_output where factoryid=" + oRs1.ReadData("factoryid").ToString()
Dim oRs2 As New DbConn(factoryQuery3)

'Iterate through each record
While oRs2.ReadData.Read()
'Generate <set value='..' />
xmlData.Append("<set value='" & oRs2.ReadData("quantity").ToString() & "'/>")
End While

oRs2.ReadData.Close()
'Close dataset element
xmlData.Append("</dataset>")
End While

oRs1.ReadData.Close()
'Close chart element
xmlData.Append("</chart>")

'Create the chart - Multi-Series Line Chart with data from xmlData
Return FusionCharts.RenderChart("../FusionCharts/MSLine.swf", "", xmlData.ToString(), "chartid", "600", "400", False, True)

End Function

Protected Sub Page_Load(ByVal sender As Object, ByVal e As System.EventArgs) Handles Me.Load
Literal1.Text = mschartsconnection()
End Sub
The following actions are taking place in this code:
- We first include FusionCharts.js JavaScript class and FusionCharts.dll
- We query database for all distinct dates to add them as categories labels of the chart (categories are stored in xmlData StringBuilder object)
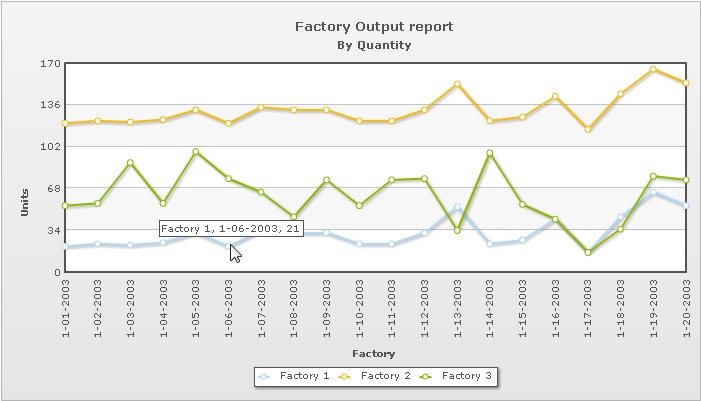
- Next, we query database for all factory-wise and dates-wise output data to add them to chart data where data for each factory becomes a dataset (datasets are appended into xmlData StringBuilder object)
- Finally, we render the chart using the RenderChart() method and pass xmlData as dataStr
The chart will look as shown in the image below:
We have used DataConnection Namespace in the above code and in all subsequent Database examples. Using this class we establish connection to the MS Access database with ADO.NET component. Let's go through the lines of code inside this class:
Imports Microsoft.VisualBasic
Imports System.Data.Odbc
Imports System.Data
Imports System.Web
Imports System.Configuration
Namespace DataConnection

''' <summary>
''' DataBase Connection Class.
''' </summary>

   Public Class DbConn
   Public connection As OdbcConnection
   Public ReadData As OdbcDataReader
   Public aCommand As OdbcCommand

''' <summary>
''' Data Connection and get Data Reader
''' </summary>

''' <param name="strQuery">SQL Query</param>
Public Sub New(ByVal strQuery As String)
Dim ConnectionString As String, connectionName As String
' MS Access DataBase Connection - Defined in Web.Config
connectionName = "MSAccessConnection"
 '' SQL Server DataBase Connection - Defined in Web.Config
'' connectionName = "SQLServerConnection";
' Creating Connection string using web.config connection string
ConnectionString = ConfigurationManager.ConnectionStrings(connectionName).ConnectionString
Try
' Creating OdbcConnection Object
connection = New OdbcConnection()
' Setting Connection String
connection.ConnectionString = ConnectionString
' Open Connection
connection.Open()
' get reader
GetReader(strQuery)
Catch ex As Exception
HttpContext.Current.Response.Write(ex.Message)
End Try
End Sub

''' <summary>
''' Create an instance dataReader
''' </summary>
''' <param name="strQuery">SQL Query</param>
''' <remarks>Return type object of OdbcDataReader</remarks>
Public Sub GetReader(ByVal strQuery As String)
'Create a Command objectaCommand = New OdbcCommand(strQuery, connection)
' Create data reader object using strQuery string
ReadData = aCommand.ExecuteReader(CommandBehavior.CloseConnection)
End Sub
End Class
End Namespace
What it does:
Set up Connection as per the connection string defined in web.config file.
<connectionStrings>
	<add name="MSAccessConnection" providerName="System.Data.Odbc"
	connectionString="Driver={Microsoft Access Driver (*.mdb)};Dbq=|DataDirectory|\FactoryDB.mdb"/>
</connectionStrings>
To change your connection to any other database server, you only need to setup web.config file.
The code to connect to SQL Server Database is also given in comment form. To connect to SQL Server you have to activate the corresponding code.
It accepts SQL Query, executes it and returns the result as ASP.NET DataReader object -ReadData.