In this section, we will show you how to use FusionCharts XT and ASP to plot charts from data contained in a database. Here, we will do the following::
- Create a pie chart to show "Production by Factory" by initially using the Data String method.
- Convert the chart to use Data URL method.
We have used the MySQL database here. The database dump is present in Download Package > Code > ASPClass > DB folder. You can, however, use any database with FusionCharts XT including MS SQL, Oracle, Access, etc.
Before you go further with this page, we recommend you to please see the previous section, Basic Examples, as we start off from concepts explained in that page.
The code examples contained in this page are present in Download Package > Code > ASPClass > DBExample folder. The MySQL database dump is present in Download Package > Code > ASPClass > DB.
Before we code the ASP pages to retrieve data, let's quickly have a look at the database structure.
The database contains just two tables:
- Factory_Master: To store the name and ID of each factory (Columns : FactoryID & FactoryName ) .
- Factory_Output: To store the number of units produced by each factory for a given date.(Columns : FactoryId, DatePro, Quantity) .
For demonstration, we have fed some dummy data in the database. Let's now shift our attention to the ASP page that will interact with the database, fetch data and then render a chart.
The ASP page for Data String method example is named as BasicDBExample.asp (in DBExample folder). It contains the following code:
<%@LANGUAGE="VBSCRIPT"%>
<% option explicit %>
<%
'We have included ../Includes/FusionCharts_Gen.asp, which contains
'FusionCharts ASP Class to help us easily embed charts
'We have also used ../Includes/DBConn.asp to easily connect to a database.
%>
<!--#include file="../Includes/DBConn.asp"-->
<!--#include file="../Includes/FusionCharts_Gen.asp"-->
<HTML>
<HEAD>
<TITLE>FusionCharts XT - Database Example</TITLE>
<%
'You need to include the following JS file, if you intend to embed the chart using JavaScript.
'Embedding using JavaScripts avoids the "Click to Activate..." issue in Internet Explorer
'When you make your own charts, make sure that the path to this JS file is correct. Else, you will get JavaScript errors.
%>
<SCRIPT LANGUAGE="Javascript" SRC="../../FusionCharts/FusionCharts.js"></SCRIPT>
</HEAD>
<BODY>
<h2><a href="http://www.fusioncharts.com" target="_blank">FusionCharts XT</a> -Database and Drill-Down Example</h2>
<%
'In this example, we show how to connect FusionCharts XT to a database.
'For the sake of ease, we have used an MySQL databases containing two
'tables.
dim FC
' Create FusionCharts ASP class object
set FC = new FusionCharts
' Set chart type to pie 3D
Call FC.setChartType("pie3d")
' Set chart size
Call FC.setSize("650","450")
' Set Relative Path of SWF file.
Call FC.setSWFPath("../../FusionCharts/")
dim strParam
' Define chart attributes
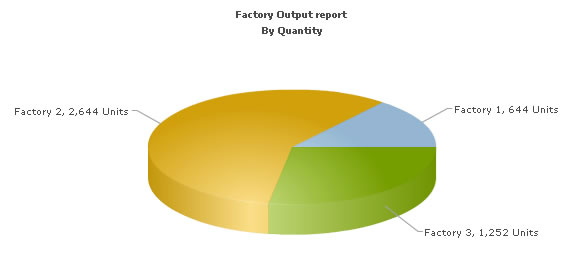
strParam="caption=Factory Output report;subCaption=By Quantity;pieSliceDepth=30;numberSuffix= Units;decimals=0"
' Set chart attributes
Call FC.setChartParams(strParam)
Dim oRs
'Create the recordset to retrieve data
Set oRs = Server.CreateObject("ADODB.Recordset")
' Fetch all factory records using SQL Query
' Store chart data values in 'total' column/field and category names in 'FactoryName'
dim strQuery
strQuery = "select a.FactoryID, b.FactoryName, sum(a.Quantity) as total from Factory_output a,
Factory_Master b where a.FactoryId=b.FactoryId group by a.FactoryId,b.FactoryName"
Set oRs = oConn.Execute(strQuery)
'Pass the SQL Query result to the FusionCharts ASP Class function
'along with field or column names that are storing chart values and corresponding category names
'to set chart data from database
if not oRs.bof then
Call FC.addDataFromDatabase(oRs, "total", "FactoryName", "" ,"")
end if
' Close Recordset
oRs.Close
set oRs=Nothing
' Render the chart
Call FC.renderChart(false)
%>
</BODY>
</HTML>These are the steps that we performed in the above code:
- Included the FusionCharts_Gen.asp, DBConn.asp and FusionCharts.js files for easy chart rendering and database connection set up. DBConn.asp contains connection parameters to connect to MySQL database.
- Created an object of FusionCharts ASP class for Pie 3D chart.
- Set the relative path of chart SWF file.
- Stored the chart attributes in a variable strParam.
- Set chart attributes through the setChartParams() function.
- Fetched factory records and stored the results in result. The query result creates a column or field, total,to store chart data and another column FactoryName to store category names.
- Add data using the addDataFromDatabase() function passing the column names that store chart data values and category names.
- Close database connection.
- Render chart by the renderChart() function.
Please go through the FusionCharts ASP Class API Reference section to know more about the functions used in the above code.
When you now run the code, you will get an output as under:
Let's now convert this example to use the Data URL method. As previously explained, in the Data URL mode, you need two pages:
- Chart Container Page - The page which embeds the HTML code to render the chart. This page also tells the chart where to load the data from. We will name this page as Default.asp.
- Data Provider Page - This page provides the XML data to the chart. We will name this page as PieData.asp
The pages in this example are contained in Download Package > Code > ASPClass > DB_dataURL folder.
Default.asp contains the following code to render the chart:
<%@LANGUAGE="VBSCRIPT"%>
<% option explicit %>
<%
 'We have included ../Includes/FusionCharts.asp, which contains functions
 'to help us easily embed the charts.
%>
<!--#include file="../Includes/FusionCharts.asp"-->
<HTML>
 <HEAD>
  <TITLE>FusionCharts XT - Data URL and Database  Example</TITLE>
  <%
   'You need to include the following JS file, if you intend to embed the chart using JavaScript.
   'Embedding using JavaScripts avoids the "Click to Activate..." issue in Internet Explorer
   'When you make your own charts, make sure that the path to this JS file is correct. Else, you will get JavaScript errors.
  %>
  <SCRIPT LANGUAGE="Javascript" SRC="../../FusionCharts/FusionCharts.js"></SCRIPT>
 </HEAD>
 <BODY>
  <h2><a href="http://www.fusioncharts.com" target="_blank">FusionCharts XT</a> - Data URL and Database</h2>

  <%
   'In this example, we show how to connect FusionCharts XT to a database
   'using the FusionCharts ASP class. In our other examples, we have used Data String method
   'where the XML is generated in the same page as chart. Here, the XML data
   'for the chart will be generated in PieData.asp.

   'For the sake of ease, we have used an MySQL databases containing two tables.

   'The asp script in piedata.asp interacts with the database,
   'converts the data into proper XML form and finally
   'relays XML data document to the chart
    dim strDataURL
    strDataURL = "PieData.asp"

   'Create the chart - Pie 3D Chart with dataURL as strDataURL
   Response.Write(renderChart("../../FusionCharts/Pie3D.swf", strDataURL, "", "FactorySum", 650, 450, false, false,false))

  %>
 </BODY>
</HTML>
In the above code, we have:
- Included FusionCharts.js JavaScript class that uses codes to easily render FusionCharts XT.
- Included FusionCharts.asp, a ASP wrapper class to load charts easily.
- Stored the return value of PieData.asp in strDataURL.
- Finally, we rendered the chart using the renderChart() method using Data URL method.
PieData.asp contains the following code to output XML Data. This code is similar like the Simple DB Example. The only difference is, here we do not render the chart but send the full XML as output stream.
<%@LANGUAGE="VBSCRIPT"%>
<% option explicit %>
<%
'We have included  ../Includes/DBConn.asp, which contains functions
'to help us easily connect to a database.
%>
	<!--#include file="../Includes/DBConn.asp"-->
	<%
		'We have included ../Includes/FusionCharts_Gen.asp, which FusionCharts ASP Class
		'to help us easily embed the charts.
	%>
	<!--#include file="../Includes/FusionCharts_Gen.asp"-->
	<%
		'This page generates the XML data for the Pie Chart contained in
		'Default.asp.
		'For the sake of ease, we have used an MySQL databases containing two
		'tables.
		dim FC
		' Create FusionCharts ASP class object
		set FC = new FusionCharts
		' Set chart type to Pie 3D
		Call FC.setChartType("Pie3D")
		' Set Relative Path of SWF file.
		Call FC.setSWFPath("../../FusionCharts/")
		dim strParam
		' Define chart attributes
		strParam="caption=Factory Output report;subCaption=By Quantity;pieSliceDepth=30;numberSuffix= Units;decimals=0"
		'Set chart attributes
		Call FC.setChartParams(strParam)
		' Fetch all factory records using SQL Query
		' Store chart data values in 'total' column/field and category names in 'FactoryName'
		dim strQuery
		strQuery = "select a.FactoryID, b.FactoryName, sum(a.Quantity) as total from Factory_output a, Factory_Master b
		where a.FactoryId=b.FactoryId group by a.FactoryId,b.FactoryName"
		Dim oRs
		'Create the recordset to retrieve data
		Set oRs = Server.CreateObject("ADODB.Recordset")
		Set oRs = oConn.Execute(strQuery)
		'Pass the SQL Query result to the FusionCharts ASP Class function
		'along with field or column names that are storing chart values and corresponding category names
		'to set chart data from database
		If Not oRs.bof Then
		Call FC.addDataFromDatabase(oRs, "total", "FactoryName", "", "")
		End If
		oRs.Close
		set oRs=Nothing
		'Set Proper output content-type
		Response.ContentType= "text/xml"
		'Just write out the XML data
		'NOTE THAT THIS PAGE DOESN'T CONTAIN ANY HTML TAG, WHATSOEVER
		Response.Write(FC.getXML())
	%>
- Included FusionCharts_Gen.asp and DBConn.asp files.
- Set connection to database through the connectToDB() function.
- Created an object of FusionCharts ASP class for Pie 3D chart.
- Set the relative path of chart SWF file.
- Stored chart attributes in the strParam variable.
- Set chart attributes using the setChartParams() function.
- Fetched records from database and stored the query output in result.
- Passed result to the addDataFromDatabase() function to add chart data.
- Wrote the XML to output stream.