The Glow Style Type lets you apply a glowing outline around any chart object.
See it live!
Note: In JavaScript charts, customized glow style type is not available.
It has the following configurable properties:
| Properties | Description |
| color | The color of the glow in hex code (without #). The default value is FF0000. |
| alpha | The alpha transparency value for the shadow color. Valid values are 0 to 100. For example, 25 sets a transparency value of 25%. |
| blurX | The amount of horizontal blur. Valid values are 0 to 255. The default value is 8. Values that are a power of 2 (such as 2, 4, 8, 16 and 32) are optimized to render more quickly than other values. |
| blurY | The amount of vertical blur. Valid values are 0 to 255. The default value is 8. Values that are a power of 2 (such as 2, 4, 8, 16 and 32) are optimized to render more quickly than other values. |
| strength | The strength of the imprint or spread. The higher the value, the more color is imprinted and the stronger the contrast between the glow and the background. Valid values are 0 to 255. The default is 2. |
| quality | The number of times to apply the effect. Valid values are 0 to 15. The default value is 1, which is equivalent to low quality. A value of 2 is medium quality, and a value of 3 is high quality. Glows with lower values are rendered quicker. |
To define a glow's color and alpha, you use the following code:
| Property | Format | Example |
| color | color='Hex Value (without #)' | color='FF5904' |
| alpha | alpha='value (between 0 to 100)' | alpha='55' |
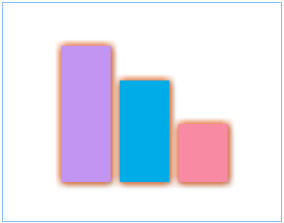
It gives the following result:
You can configure the blur amount of glow as under:
| Property | Format | Example |
| blurX | blurX='value' | blurX='13' |
| blurY | blurY='value' | blurY='13' |
|
 |
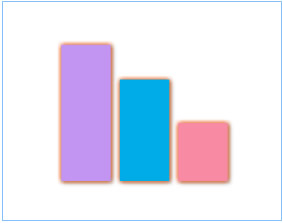
Original chart with
default blur |
With blurX and blurY
set to 13 |
You can also control the glow strength and quality to get better results.
Following example shows a glow with higher strength:
<style name='MyFirstGlow' type='Glow' color='FF5904' alpha='55' strength='3'/>
<style name='MyFirstGlow' type='Glow' color='FF5904' alpha='55' quality='10'/>
 "definition":[{ "name":"MyFirstGlow", "type":"Glow", "color":"FF5904", "alpha":"55", "strength":"3" },
               { "name":"MyFirstGlow", "type":"Glow", "color":"FF5904", "alpha":"55", "quality":"10" }]
| Property | Format | Example |
| quality | quality='value' | quality='10' |
| strength | strength='value' | strength='3' |
|
 |
Original chart with
default strength & quality |
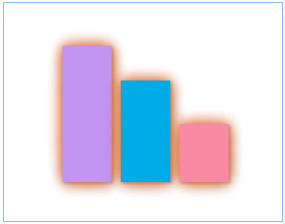
With enhanced strength & quality |
You can apply glow to any object of the chart. It is not just restricted to dataplot. However, too much application might result in slower rendering of the chart.