The Blur Style Type is the simplest of all style types, which basically helps to blur any chart object for visual effect.
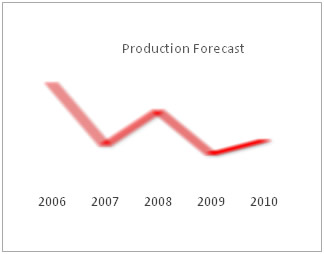
See it live!
Note: In JavaScript charts, customized blur style type is not available.
It has the following parameters:
| Properties | Description |
| blurX | The amount to blur horizontally. Valid values are from 0 to 255. The default value is 4. Values that are a power of 2 (such as 2, 4, 8, 16 and 32) are optimized to render quicker than other values. |
| blurY | The amount to blur vertically. |
| quality | The number of times to apply the filter. The default value is 1, which is equivalent to low quality. A value of 2 is medium quality, and a value of 3 is high quality and approximates a Gaussian blur. |
You can configure the amount of blur as under:
| Property | Format | Example |
| blurX | blurX='value' | blurX='6' |
| blurY | blurY='value' | blurY='6' |
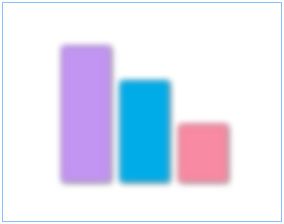
When applied to columns, it gives the following effect:
 |
||||||
| Controlling blur quality | ||||||
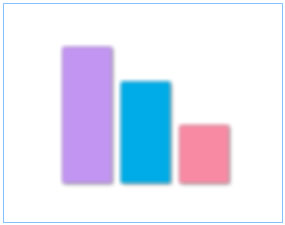
To change the quality of the blur, use the quality attribute as under: | ||||||
|
||||||
It gives the following output:
|