FusionCharts JavaScript class allows you to get data back from chart. Using API functions you can retrieve the chart data, along with all attributes or properties, in XML or JSON format. You can also retrieve the chart data in CSV format.
Moreover, you can read all chart attributes from a chart. By "chart attribute", we mean all the XML attributes or JSON properties which are passed through <chart> element in chart XML data or through chart property in chart's JSON data.
In this page, we will learn how to:
- Get chart data in XML format
- Get chart data in JSON format
- Get chart data in CSV format
- Retrieve a chart attribute from chart
Code examples discussed in this section are present in Download Package > Code > JavaScript > Basics folder.
You can get chart XML data using FusionCharts JavaScript class API. FusionCharts XT provides various functions as listed below to achieve this:
- getXMLData() » This function can only be called on FusionCharts JavaScript Object.
- getChartData( format ) » This function takes data format ("xml" or "json") of the data as parameter. This function can only be called on FusionCharts JavaScript Object.
- getXML() » This legacy function can be called on both FusionCharts HTML Object and FusionCharts JavaScript Object. This function is deprecated.
Let us now see how these functions work in code:
Get XML data from a chart using chart HTML Object
var chartReference = FusionCharts("myChartId");
var chartXML = chartReference.getXMLData();
Click here to see a complete implementation code sample »
<html>
<head>
<title>Update Chart data</title>
<script type="text/javascript" src="../../FusionCharts/FusionCharts.js">
</script>
</head>
<body>
<div id="chartContainer">FusionCharts XT will load here!</div>
<script type="text/javascript"><!--
var myChart = new FusionCharts("../../FusionCharts/Column3D.swf", "myChartId", "400", "300", "0", "1");
myChart.setXMLUrl("AugustData.xml");
myChart.render("chartContainer");
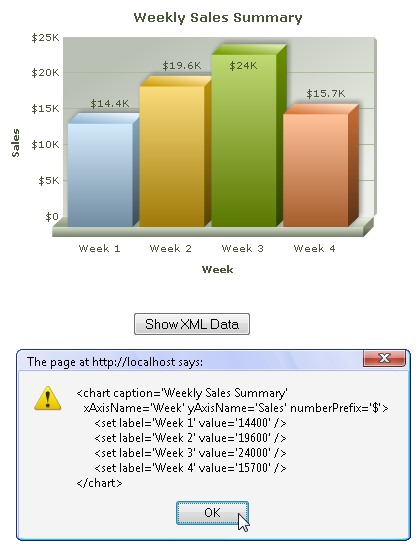
function showData(format)
{
var chartReference = FusionCharts( "myChartId" );
alert(chartReference.getXMLData());
}
// -->
</script>
<input type="button" onClick="showData('xml');" value="Show XML Data">
</body>
</html>
See it live!
Other functions
Get XML data from a chart using getXMLData() on FusionCharts JavaScript Object
var chartReference = FusionCharts.items[ "myChartId" ];
var chartXML = chartReference.getXMLData();
See it live!
Get XML from a chart using getChartData() function on FusionCharts JavaScript Object
var chartReference = FusionCharts("myChartId");
var chartXML = chartReference.getChartData("xml");
See it live!
Get XML from a chart using getXML() function on FusionCharts HTML Object
var chartReference = FusionCharts("myChartId");
var chartXML = chartReference.getXML();
See it live!
The function getXML() is deprecated.
You can get chart JSON data using FusionCharts JavaScript class API. FusionCharts XT provides various functions as listed below to achieve this:
- getJSONData() » This function can only be called on FusionCharts JavaScript Object.
- getChartData( format ) » This function takes data format ("xml" or "json") of the data as parameter. This function can only be called on FusionCharts JavaScript Object.
Let us now see how these functions work in code:
Get JSON data from a chart using getJSONData() function
var chartReference = FusionCharts("myChartId");
var chartJSON = chartReference.getJSONData();
See it live!
Get JSON data from a chart using getChartData() function
var chartReference = FusionCharts("myChartId");
var chartXML = chartReference.getChartData("json");
See it live!
You can access the data of the chart from FusionCharts JavaScript API as well. All you need to do is call API function - getDataAsCSV() » This legacy function can be called either on FusionCharts HTML Object or FusionCharts JavaScript Object.
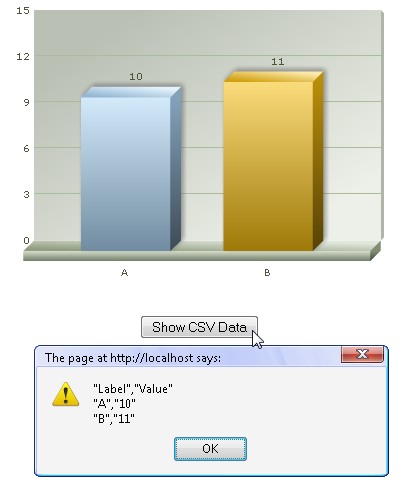
Let us see a small sample which gets CSV data from chart and display it in a JavaScript alert box as shown in the image below:
<html>
  <head>
    <title>Getting CSV data from chart</title>
    <script type="text/javascript" src="FusionCharts/FusionCharts.js">
    </script>
  </head>
  <body>
    <div id="chartContainer">FusionCharts XT will load here!</div>
    <script type="text/javascript"><!--

      var myChart = new FusionCharts( "FusionCharts/Column3D.swf", "myChartId", "400", "300", "0", "0" );
      myChart.setXMLData("<chart><set label='A' value='10' /><set label='B' value='11' /></chart>");
      myChart.render("chartContainer");

    // -->
    </script>
    <input onclick = "alert(FusionCharts('myChartId').getDataAsCSV())" type="button" value="Get CSV Data from chart">
  </body>
</html>
In the above code, we are first creating a Column 3D chart with DOM Id as myChartId. We provide the following data to the chart and ask it to render:
<chart>
  <set label='A' value='10' />
  <set label='B' value='11' />
</chart>
Thereafter, we are creating a button, which when clicked, exports CSV data from the chart and shows in an alert box. We get the FusionCharts JavaScript Object reference of the chart by FusionCharts('myChartId').
onclick = "alert(FusionCharts('myChartId').getDataAsCSV())"
See it live!
Note that the CSV data provides only the data of the chart's dataplot devoid of all properties and trend line definitions.
myChart.getDataAsCSV();
...
FusionCharts.getObjectReference("myChartId").getDataAsCSV();
...
FusionCharts.items["myChartId"].getDataAsCSV();
You can customize the output format of CSV data by setting various chart attributes in XML or JSON data. You can set the value separator, value qualifier and whether to show formatted data values. Read Exporting Chart Data > Using JavaScript API to know more on the attributes that configure CSV output format.
You can read a particular chart property (also known as "chart attribute" which is passed through <chart> element in chart XML data or through chart property in chart's JSON data) from a chart using FusionCharts JavaScript API call - getChartAttribute() » This legacy function can be called either using FusionCharts HTML Object or FusionCharts JavaScript Object.
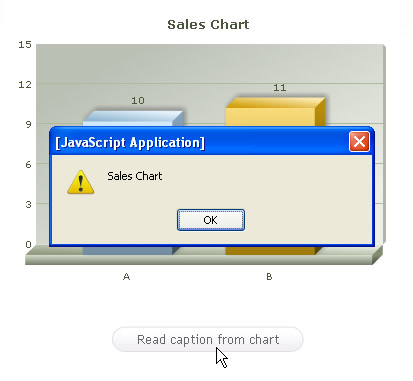
Let us build a sample which reads the caption of a chart and displays it in a JavaScript alert box as shown in the image below:
<html>
  <head>
    <title>Getting CSV data from chart</title>
    <script type="text/javascript" src="FusionCharts/FusionCharts.js">
    </script>
  </head>
  <body>
    <div id="chartContainer">FusionCharts XT will load here!</div>
    <script type="text/javascript"><!--

      var myChart = new FusionCharts( "FusionCharts/Column3D.swf", "myChartId", "400", "300", "0", "1" );
      myChart.setXMLData("<chart caption='Sales Chart'><set label='A' value='10' /><set label='B' value='11' /></chart>");
      myChart.render("chartContainer");

    // -->
    </script>
    <input onclick = "alert(FusionCharts('myChartId').getChartAttribute('caption'))" type="button" value="Read caption from chart">
  </body>
</html>
See it live!
The above code does the following:
- It creates a chart with a caption - "Sales Chart"
- an HTML button is created which when clicked will call getChartAttribute of the rendered chart
- The function is passed 'caption' as parameter
When the button is clicked, getChartAttribute() function retrieves the value of caption attribute, that is, "Sales Chart" from the chart and displays in an alert box. We get the FusionCharts JavaScript Object reference of the chart by FusionCharts('myChartId').
To know more on the function getChartAttribute() please read API Reference> Functions page.