FusionCharts JavaScript class allows you to change various settings and properties of an existing chart. You can dynamically update chart's root properties (also known as "chart attributes" which are passed through <chart> element in chart XML data or through chart property in chart's JSON data) on-the-fly. This feature will come handy when you wish to change the chart titles, theme colors, number formatting or scaling setup, divisional line and grid configurations and other functional and cosmetic features of an existing chart. While the API allows you to update selective properties, internally, FusionCharts XT re-draws the entire chart.
Moreover, you can also change chart's width and height at run-time.
All the chart attributes are listed under "<chart> element attributes" section of each chart page in Chart XML API section.
You need to use setChartAttribute() function to set a chart attribute. All you need to do is pass the name of the attribute and its new value to this function. This function is available in all the instances of FusionCharts JavaScript class. If you wish to change more than one chart attributes at one go, you can pass multiple attributes and their respective values as an Object. Each property name of the Object will take the name of the attribute. Value of each property will take the new value of the attribute.
Let us take some samples to illustrate the working of the function:
myChart.setChartAttribute( "caption" , "Latest sales report" );
See it live!
In the above code we pass the attribute name as the first parameter and the new value as the second parameter.
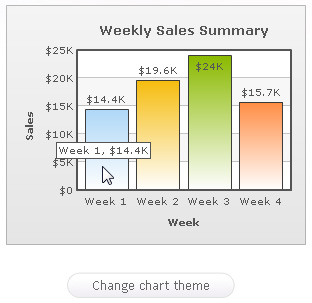
Let us create a small sample that changes color theme of an existing chart as shown in the images below:
 |
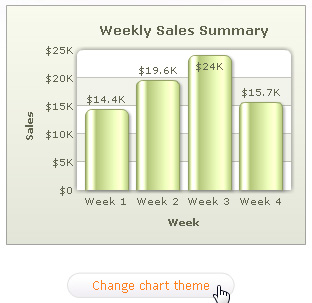 |
| The chart after rendered for the first time | Chart with changed theme |
See it live!
<html>
  <head>
    <title>Update Chart data</title>
    <script type="text/javascript" src="../../FusionCharts/FusionCharts.js">
    </script>
  </head>
  <body>
    <center>
    <div id="chartContainer">FusionCharts XT will load here!</div>
    <script type="text/javascript"><!--

      var myChart = new FusionCharts( "../../FusionCharts/Column2D.swf",
        "myChartId", "300", "240", "0", "1" );
      myChart.setXMLUrl("Data.xml");
      myChart.render("chartContainer");

	  function changeAttribute()
	  {
		  // get chart reference
		  var chartReference = FusionCharts( "myChartId" );

		  // change palette, palette colors and set glass effect to chart
		  chartReference.setChartAttribute( { "palette" : "2", paletteColors : "ACBF72", useRoundEdges : 1 } );
	  }
    // -->
    </script>

    <input type="button" onClick="changeAttribute();" value="Change Chart Theme" >
    </center>
  </body>
</html>
In the above code we have done the following:
- We created a chart
- We placed a button that calls changeAttribute() function
- We got chart reference using FusionCharts("myChartId") function
- We passed an object containing new attribute values to setChartAttribute() function
- The object contains three attributes as three properties - palette, paletteColors and useRoundEdges. If you have to update multiple properties of the chart at once, it is recommended to use the object notation as used in this code and pass all of them at once. This eliminates the need for multiple re-draws.
Other samples
var chartReference = FusionCharts("myChartId");
chartReference.setChartAttribute({"subCaption" : "new sub-title"});
See it live!
In the above code we pass an object as the parameter.
Change number formatting settings
var chartReference = FusionCharts("myChartId");
chartReference.setChartAttribute({formatNumberScale : 1, decimals : 2, yAxisForceDecimals : 1});
See it live!
var chartReference = FusionCharts("myChartId");
chartReference.setChartAttribute({showAlternateHGridColor : 1, alternateHGridColor : "ACBF72"});
See it live!
var chartReference = FusionCharts("myChartId");
chartReference.setChartAttribute("showTooltip",0);
See it live!
Set off shadow and lighting effects
var chartReference = FusionCharts("myChartId");
chartReference.setChartAttribute({"showShadow" : "0", "use3DLighting" : "0"});
See it live!
Listed below are the few limitations of setChartAttribute() function:
- setChartAttribure() works only using FusionCharts JavaScript Object reference. This function is not available if you use FusionCharts HTML Object reference.
- You can update only those attribute which are available in <chart> element of a chart's XML data or "chart" property of a chart's JSON data.
FusionCharts JavaScript class provides an easy function to set chart messages and Grid settings. For this you need to use configure() function.
When you wish to set a chart message this function takes the message attribute name and the custom message that you wish to set. Let us take a sample as shown below:
<div id="chartContainer">FusionCharts XT will load here</div>
<script type="text/javascript"><!--
  var myChart = new FusionCharts("Column2D.swf", "myChartId", "300", "250", "0", "1");
  myChart.setXMLUrl("<chart></chart>");
  myChart.configure("ChartNoDataText", "Please select a record above");
  myChart.render("chartContainer");
// --></script>
The line myChart.configure("ChartNoDataText", "Please select a record above") sets a custom chart message when the chart does not find any data to plot.
There are advanced ways to use configure() function while setting the chart messages. For details read Advanced Charting > Changing Chart Messages page.
Most of the settings of a Grid component are to be set using configure() function. Let us take an example:
<html>
  <head>
    <script language="JavaScript" src="../FusionCharts/FusionCharts.js"></script>
  </head>
  <body bgcolor="#ffffff">
    <div id="griddiv" align="center">The grid will appear within this DIV.</div>
    <script type="text/javascript">
        var myGrid = new FusionCharts("../FusionCharts/SSGrid.swf", "myGrid1", "300", "200", "0", "1");
        myGrid.setXMLUrl("Data.xml");
        //Set Grid specific parameters
        myGrid.configure('showPercentValues', '1');
        myGrid.configure('showShadow', '1');
        myGrid.render("griddiv");
    </script>
  </body>
</html>
In the above sample we have created a grid. We used configure() function to show shadow and values in percentage.
FusionCharts JavaScript Class allows you to resize an existing chart using resizeTo() function. You can pass the new width and height of the chart in pixels or percent parameters of resizeTo() function. You can also make change width and height property of the chart object and then call resizeTo() function. The code samples below shows how you can do this:
Resize chart using pixel values
var chartReference = FusionCharts( "myChartId" );
chartReference.resizeTo( "500", "350" );
See it live!
Resize chart using percent values
var chartReference = FusionCharts( "myChartId" );
chartReference.resizeTo( "80%", "75%" );
See it live!
Resize chart setting width and height properties
var chartReference = FusionCharts( "myChartId" );
chartReference.width = "500";
chartReference.height = "80%";
chartReference.resizeTo();
Please note that resizeTo()function, width and height properties only work using FusionCharts JavaScript object. It is not available in FusionCharts HTML Object.
Code examples discussed in this section are present in Download Package > Code > JavaScript > Basics folder.