In this page, we will show you how to use data from HTML Forms and render a chart using that data.
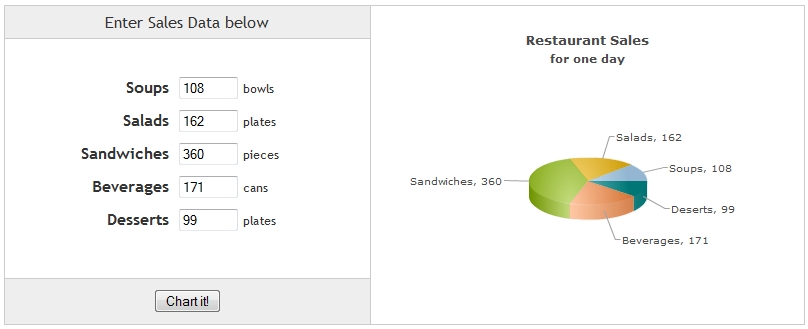
We will build a simple restaurant sales example, where one will enter the items sold by a restaurant in a day. We will acquire this data and plot it on a chart. For the sake of simplicity, we will not do any validation on this data. However, your real life applications might process data before presenting it on the chart.
The code examples contained in this page are present in Download Package > Code > MyFirstChart > FormBased.html
See it live!
The code for the above application is given below:
<html>
    <head>
	<title>FusionCharts XT - Form Based Data Charting Example</title>

        <script type="text/javascript" src="../../Charts/FusionCharts.js"></script>

    </head>

    <body>

	<input type='text' size='5' id='soups' value='108'/> <span>bowls</span>
	<input type='text' size='5' id='salads' value='162'/> <span>plates</span>
	<input type='text' size='5' id='sandwiches' value='360'/> <span>pieces</span>
	<input type='text' size='5' id='beverages' value='171'/> <span>cans</span>
	<input type='text' size='5' id='deserts' value='99'/> <span>plates</span>

 	<input name="button" type='button' value='Chart it!' onclick="chartIt();" />

	<div id="chartContainer">FusionCharts XT will load here</div>

   <script type="text/javascript">

	function chartIt()
		{
		  // retrieving Form data
		  var soupSales = document.getElementById("soups").value;
		  var saladsSales = document.getElementById("salads").value;
		  var sandwichesSales = document.getElementById("sandwiches").value;
		  var beveragesSales = document.getElementById("beverages").value;
		  var desertsSales = document.getElementById("deserts").value;

		  // creating chart data from Form data
		  var chartXMLData = "";
		  chartXMLData += "<chart caption='Restaurant Sales' subCaption='for one day' >";
		  chartXMLData += "<set label='Soups' value='" + soupSales + "' />";
		  chartXMLData += "<set label='Salads' value='" + saladsSales + "' />";
		  chartXMLData += "<set label='Sandwiches' value='" + sandwichesSales + "' />";
		  chartXMLData += "<set label='Beverages' value='" + beveragesSales + "' />";
		  chartXMLData += "<set label='Deserts' value='" + desertsSales + "' />";
		  chartXMLData += "</chart>";

		  //rendering the chart
		  var myChart = new FusionCharts( "../../Charts/Pie3D.swf", "myChartId", "400", "300", "0" );
		  myChart.setXMLData( chartXMLData );
		  myChart.render( "chartContainer" );
	     }
    </script>

    </body>
</html>
See it live!
- We have included the JavaScript class file FusionCharts.js
- We have created five text input boxes for five products
- We have set each text input box with an id which can be used to refer to its value
<input type='text' size='5' id='soups' value='108'/> <span>bowls</span>
<input type='text' size='5' id='salads' value='162'/> <span>plates</span>
<input type='text' size='5' id='sandwiches' value='360'/> <span>pieces</span>
<input type='text' size='5' id='beverages' value='171'/> <span>cans</span>
<input type='text' size='5' id='deserts' value='99'/> <span>plates</span>
- A button is placed below the text input boxes to call a JavaScript function - chartIt() when clicked
<input name="button" type='button' value='Chart it!' onclick="chartIt();" />
- The function first retrieves all the values from the text input boxes
var soupSales = document.getElementById("soups").value;
var saladsSales = document.getElementById("salads").value;
var sandwichesSales = document.getElementById("sandwiches").value;
var beveragesSales = document.getElementById("beverages").value;
var desertsSales = document.getElementById("deserts").value;
- It creates an XML string for the chart with all the retrieved values
var chartXMLData = "";
chartXMLData += "<chart caption='Restaurant Sales' subCaption='for one day' >";
chartXMLData += "<set label='Soups' value='" + soupSales + "' />";
chartXMLData += "<set label='Salads' value='" + saladsSales + "' />";
chartXMLData += "<set label='Sandwiches' value='" + sandwichesSales + "' />";
chartXMLData += "<set label='Beverages' value='" + beveragesSales + "' />";
chartXMLData += "<set label='Deserts' value='" + desertsSales + "' />";
chartXMLData += "</chart>";
- It renders a pie chart and passes the XML string to the chart
var myChart = new FusionCharts( "../../Charts/Pie3D.swf", "myChartId", "400", "300", "0" );
myChart.setXMLData( chartXMLData );
myChart.render( "chartContainer" );