In our previous example, we had used FusionCharts XT to plot a chart using data stored in database. We will now extend that example itself to create a drill-down chart which can show more information.
If you recall from previous example, we were showing the sum of factory output in a pie chart as under:
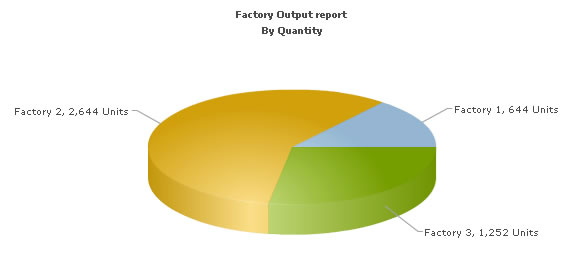
In this example, we will extend it, so that when users click a pie slice for a factory, they can drill down to see date wise production for that factory.
To set up the pie chart in a way to enable links for drill-down involves just minor tweaking of our previous bean used in BasicDBExampleUsingBean.jsp. We basically need to add the link attribute for each <set> element. We create a new page Default.jsp from the previous page in DBExample folder with exactly same code. We create a bean FactoriesWithLinkToDetailedBean with following code to construct XML: (getFactoryXML())
//strXML will be used to store the entire XML document generated
String strXML="";
try{
  DBConnection dbConn = new DBConnection();
  Connection oConn= dbConn.getConnection();

  //Database Objects - Initialization

  Statement st1=null,st2=null;
  ResultSet rs1=null,rs2=null;
  String strQuery="";
  Map<String,String> chartAttributes=new HashMap<String, String>();;
  chartAttributes.put("caption", "Factory Output report");
  chartAttributes.put("subCaption", "By Quantity");
  chartAttributes.put("pieSliceDepth", "30");
  chartAttributes.put("showBorder", "1");
  chartAttributes.put("formatNumberScale", "0");
  chartAttributes.put("numberSuffix", " Units");
  DOMHelper domHelper = new DOMHelper();
  Document chartDoc = domHelper.getDocument();

  // generate the  chart elements and  assign the attributes to it

  Element rootElement = chartDoc.createElement("chart");
  domHelper.addAttributesToElement(rootElement, chartAttributes);

   //Iterate through each factory

  strQuery = "select * from Factory_Master";
  st1=oConn.createStatement();
  rs1=st1.executeQuery(strQuery);
  String factoryId=null;
  String factoryName=null;
  String totalOutput="";

  while(rs1.next()) {
    totalOutput="";
    factoryId=rs1.getString("FactoryId");
    factoryName=rs1.getString("FactoryName");

    //Now create second recordset to get details for this factory
    strQuery = "select sum(Quantity) as TotOutput from Factory_Output where FactoryId=" + factoryId;
    st2=oConn.createStatement();
    rs2 = st2.executeQuery(strQuery);
    if(rs2.next()){
      totalOutput=rs2.getString("TotOutput");
    }

    //Generate <set label='..' value='...' link='...'/>
    Element setElem = chartDoc.createElement("set");
    setElem.setAttribute("label", factoryName);
    setElem.setAttribute("value", totalOutput);

    // Encoding the URL since it has parameters
    String strDataURL = FusionChartsHelper.encodeDataURL("Detailed.jsp?factoryId="+factoryId,false);
    setElem.setAttribute("link", strDataURL);
    rootElement.appendChild(setElem);

    //close the resultset,statement
    //enclose them in try catch block
    //code omitted here

  }

  //Finally, close <chart> element

  chartDoc.appendChild(rootElement);
  strXML=domHelper.getXMLString(chartDoc);

  //code omitted here
  //close the resultset,statement,connection
  //enclose them in try catch block

 }catch(java.sql.SQLException e){
	System.out.println("Could not close the statement");
	}
return strXML;
As you can see in the code above, in the getFactoryXML() method, we are doing the following:
- Connecting to the database using DBConnection class.
- Generating the XML data document by iterating through the resultset. We are constructing the xml using dom. To each <set> element, we add the link attribute, which points to Detailed.jsp - the page that contains the chart to show details. We are passing the factory ID of the respective factory by appending it to the link. The value for the link attribute is then URL encoded. This is an important step.
// Encoding the URL since it has parameter
String strDataURL = FusionChartsHelper.encodeDataURL("Detailed.jsp?factoryId="+factoryId,false);
setElem.setAttribute("link", strDataURL);
- Finally, we are returning the XML as a string obtained from the xml document.
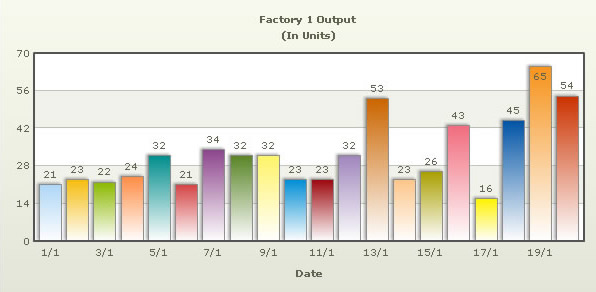
Let's now shift our attention to Detailed.jsp page - the page which renders the second chart based on the click in the first chart.
The Detailed.jsp page contains the following code:
<%@ taglib prefix="c" uri="http://java.sun.com/jsp/jstl/core"%>
<%@ taglib prefix="tags" tagdir="/WEB-INF/tags"%>
<%@ taglib uri="http://www.fusioncharts.com/jsp/core" prefix="fc"%>
<jsp:useBean id="factoryDetails" class="com.fusioncharts.sampledata.FactoryDetailsBean" />
<c:set var="folderPath" value="../../FusionCharts/" />
<c:set var="title" value="FusionCharts - Database + Drill-Down Example"	scope="request" />
<c:set var="header1" value="FusionCharts Database and Drill-Down Example" scope="request" />
<c:set var="header2" value="Detailed report for the factory" scope="request" />
<c:set var="jsPath" value="${folderPath}" scope="request"/>
<c:set target="${factoryDetails}" property="factoryId" value="${param.factoryId}"/>
<!--
    This page is invoked from Default.jsp. When the user clicks on a pie
    slice in Default.jsp, the factory Id is passed to this page. We need
    to get that factory id, get the information from database and then show
    a detailed chart.
-->
<tags:template2>
    <!-- Create the chart - Pie 3D Chart with data contained in bean -->
    <fc:render chartId="${factoryDetails.chartId}"
    swfFilename="${folderPath}${factoryDetails.filename}"
    width="${factoryDetails.width}" height="${factoryDetails.height}"
    debugMode="false" xmlData="${factoryDetails.xml}" />

</tags:template2>
In this page, we are:
- Setting the value for jsPath the path to the folder containing the JavaScript class, to enable easy embedding of FusionCharts. This is used by the template2 tag file for including the JavaScript file.
- Requesting the factory ID for which we have to show detailed data. This value was sent to us as querystring, as a part of pie chart link.
- Setting the value for factoryId in the bean FactoryDetailsBean.
- In the bean, we are getting the requisite data for this factory (identified by factoryId) from database and then converting it into XML using string concatenation. This is done in the bean and happens whenever setFactoryId() is invoked.
- Finally, rendering a Column 2D chart (${factoryDetails.filename}) to show detailed data, by using the fc:render tag.
The main code of creating the XML string is done in the bean FactoryDetailsBean. The relevant code is as follows: (getFactoryDetailsXML(String factoryId) method)
//strXML will be used to store the entire XML document generated
String strXML="";
try{
  DBConnection dbConn = new DBConnection();
  Connection oConn= dbConn.getConnection();
  //Database Objects - Initialization
  Statement st=null;
  ResultSet rs=null;
  java.sql.Date date=null;
  java.util.Date uDate=null;
  String uDateStr="";
  String quantity="";
  String strQuery="";
  Map<String,String> chartAttributes=new HashMap<String, String>();
  chartAttributes.put("caption", "Factory "+factoryId+" Output");
  chartAttributes.put("subCaption", "(In Units)");
  chartAttributes.put("xAxisName", "Date");
  chartAttributes.put("showValues", "1");
  chartAttributes.put("labelStep", "2");
  chartAttributes.put("palette", "2");
  DOMHelper domHelper = new DOMHelper();
  Document chartDoc = domHelper.getDocument();
  Element rootElement = chartDoc.createElement("chart");
  domHelper.addAttributesToElement(rootElement, chartAttributes);

  //Now, we get the data for that factory
  strQuery = "select * from Factory_Output where FactoryId=" + factoryId+ " order by DatePro Asc ";

  st=oConn.createStatement();
  rs=st.executeQuery(strQuery);

  while(rs.next()) {
    date=rs.getDate("DatePro");
    quantity=rs.getString("Quantity");
    if(date!=null) {
      uDate=new java.util.Date(date.getTime());
      SimpleDateFormat sdf=new SimpleDateFormat("dd/MM");
      uDateStr=sdf.format(uDate);
    }
    //Generate <set label='..' value='..'/>
    Element setElem = chartDoc.createElement("set");
    setElem.setAttribute("label", uDateStr);
    setElem.setAttribute("value", quantity);
    rootElement.appendChild(setElem);
  }
  //Finally, close <chart> element
  chartDoc.appendChild(rootElement);
  strXML=domHelper.getXMLString(chartDoc);
  //close the resultset,statement,connection
  //enclose them in try catch block
  // code omitted here

}catch(java.sql.SQLException e){
  System.out.println("Could not close the statement");
}

return strXML;
Here, we are iterating through all the rows in the Factory_Output table for the given factoryId and creating the <set> elements as child of the <chart> element. The date is formatted before setting it as label for the <set> element.
When you now run the app, you will see the detailed page as under: