You can specify generic font properties for all the text on the chart using the attributes given below.
| Attribute Name | Range | Description |
| baseFont | Font Name | This attribute lets you set the font face (family) of all the text (data labels, values etc.) on chart. If you specify outCnvBaseFont attribute also, then this attribute controls only the font face of text within the chart canvas bounds. |
| baseFontSize | 0-72 | This attribute sets the base font size of the chart i.e., all the values and the names in the chart which lie on the canvas will be displayed using the font size provided here. |
| baseFontColor | Hex color code without # | This attribute sets the base font color of the chart i.e., all the values and the names in the chart which lie on the canvas will be displayed using the font color provided here. |
<chart caption='Quarterly Sales Summary' subcaption='Figures in $' xAxisName='Quarter' yAxisName='Sales'
 baseFont='Arial' baseFontSize ='12' baseFontColor ='000000'>
   <set label='Qtr 1' value='420500' />
   <set label='Qtr 2' value='295400' />
   <set label='Qtr 3' value='523400' />
   <set label='Qtr 4' value='465400' />
</chart>
{
  "chart":{
    "caption":"Quarterly Sales Summary",
    "subcaption":"Figures in $",
    "xaxisname":"Quarter",
    "yaxisname":"Sales",
    "basefont":"Arial",
    "basefontsize":"12",
    "basefontcolor":"000000"
  },
  "data":[{
      "label":"Qtr 1",
      "value":"420500"
    },
    {
      "label":"Qtr 2",
      "value":"295400"
    },
    {
      "label":"Qtr 3",
      "value":"523400"
    },
    {
      "label":"Qtr 4",
      "value":"465400"
    }
  ]
}
The above will give an output as under:
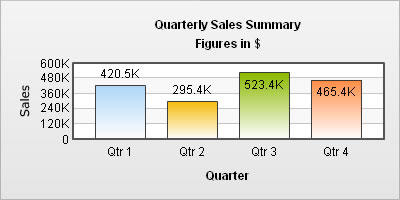
Notice that all the text on the chart has the properties as mentioned using the baseFont group attributes.
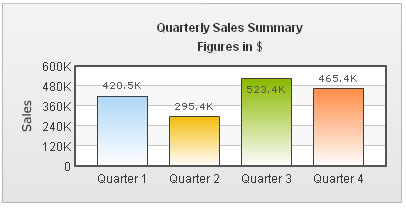
All the text in the chart can be classified into 2: the text inside the canvas which consists of only the tool tip and the data values and all the text outside the canvas. You can define a base font group for all the text outside the canvas as well.
| Attribute Name | Range | Description |
| outCnvBaseFont | Font Name | This attribute sets the base font family of the chart font which lies outside the canvas i.e., all the values and the names in the chart which lie outside the canvas will be displayed using the font name provided here. |
| outCnvBaseFontSize | 0-72 | This attribute sets the base font size of the chart i.e., all the values and the names in the chart which lie outside the canvas will be displayed using the font size provided here. |
| outCnvBaseFontColor | Hex color code without # | This attribute sets the base font color of the chart i.e., all the values and the names in the chart which lie outside the canvas will be displayed using the font color provided here. |
<chart outCnvBaseFont='Arial' outCnvBaseFontSize ='12' outCnvBaseFontColor ='000000' ... >
A chart having outside canvas base font group defined looks as under:
Using Styles, you can assign various properties to fonts - face, size, color, bold, italics, underline, background & border color and whether the text is HTML etc. With Styles, you have the option of applying the font properties to whichever text element you want rather than all the text elements.
We will see an example wherein the font properties of the data values have been changed using Styles.
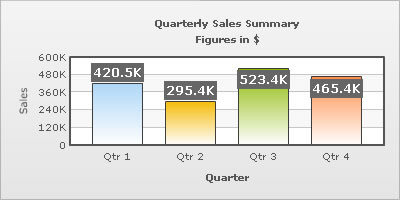
The data for this chart is as under. To read more on Styles, please refer to FusionCharts XT Styles.
<chart caption='Quarterly Sales Summary' subcaption='Figures in $' xAxisName='Quarter' yAxisName='Sales'>
   <set label='Qtr 1' value='420500' />
   <set label='Qtr 2' value='295400' />
   <set label='Qtr 3' value='523400' />
   <set label='Qtr 4' value='465400' />
   <styles>
      <definition>
         <style name='myValuesFont' type='font' size='12' color='FFFFFF' bold='1' bgColor='666666' borderColor='666666'/>
      </definition>
      <application>
         <apply toObject='DataValues' styles='myValuesFont' />
      </application>
   </styles>
</chart>
{
"chart":{
"caption":"Quarterly Sales Summary",
"subcaption":"Figures in $",
"xaxisname":"Quarter",
"yaxisname":"Sales"
},
"data":[{
"label":"Qtr 1",
"value":"420500"
},
{
"label":"Qtr 2",
"value":"295400"
},
{
"label":"Qtr 3",
"value":"523400"
},
{
"label":"Qtr 4",
"value":"465400"
}
],
"styles": {
"definition": [
{
"name": "myValuesFont",
"type": "font",
"size": "12",
"color": "FFFFFF",
"bold": "1",
"bgcolor": "666666",
"bordercolor": "666666"
}
],
"application": [
{
"toobject": "DataValues",
"styles": "myValuesFont"
}
]
}
}
The font properties that we can control using Styles are:
| Attribute | Brief Description | Sample or Valid values |
| font | Sets the font family for the text | Verdana, Arial .. |
| size | Specifies the font size | 10, 12 .. |
| color | Sets the font color, should be hex color code without # | Hex color without # |
| bold | Flag indicating whether font should be bold or not | 1 for Yes, 0 for No |
| italic | Flag indicating whether font should be italics or not | 1 for Yes, 0 for No |
| underline | Flag indicating whether font should be underlined or not | 1 for Yes, 0 for No |
| bgColor | Sets the background color for a text box, should be hex color code without # | FF0000, FFFFDD |
| borderColor | If you need a border around your text, you can use this parameter | Hex color without # |
| isHTML | Helps you set whether the text should be rendered as HTML or plain text | 1 for Yes, 0 for No |
| leftMargin | The left margin of the text, in points | Pixel value (numeric) |
| letterSpacing | The amount of space that is uniformly distributed between characters of the text | Pixel value (numeric) |
Using Styles, we can apply various effects (shadow, glow, bevel, blur) to the text elements. Here, we see a basic example where the data values have been given a glow effect.
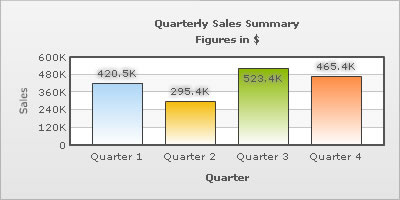
The data going into the above is:
<chart caption='Quarterly Sales Summary' subcaption='Figures in $' xAxisName='Quarter' yAxisName='Sales'>
  <set label='Quarter 1' value='420500' />
  <set label='Quarter 2' value='295400' />
  <set label='Quarter 3' value='523400' />
  <set label='Quarter 4' value='465400' />
  <styles>
     <definition>
         <style name='myGlow' type='Glow' color='9999999'/>
     </definition>
     <application>
         <apply toObject='DataLabels' styles='myGlow' />
     </application>
  </styles>
</chart>
{
"chart":{
"caption":"Quarterly Sales Summary",
"subcaption":"Figures in $",
"xaxisname":"Quarter",
"yaxisname":"Sales"
},
"data":[{
"label":"Quarter 1",
"value":"420500"
},
{
"label":"Quarter 2",
"value":"295400"
},
{
"label":"Quarter 3",
"value":"523400"
},
{
"label":"Quarter 4",
"value":"465400"
}
],
"styles": {
"definition": [
{
"name": "myGlow",
"type": "Glow",
"color": "9999999"
}
],
"application": [
{
"toobject": "DataLabels",
"styles": "myGlow"
}
]
}
}