Data values refer to the plot values i.e., values of each data plot (line, column, bar, pie etc.) displayed beside it.
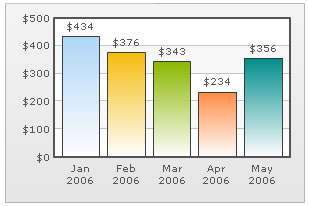
In the chart shown above, $434 or $376 appearing above the column are the data values. By default, the data values are shown. But you can hide them by setting <chart showValues='0'>. Even if you hide data values, users can see the value as part of data tool-tip when the cursor is hovered over the data plot.
Text labels instead of data values
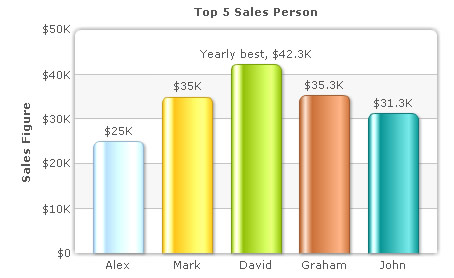
FusionCharts XT also allows you to specify custom string values instead of the numeric data values for each data item. This can be provided as displayValue attribute of <set> element as under:
<chart yAxisName='Sales Figure' caption='Top 5 Sales Person' numberPrefix='$' useRoundEdges='1' bgColor='FFFFFF,FFFFFF' showBorder='0' baseFontSize='11'>
  <set label='Alex' value='25000'  />
  <set label='Mark' value='35000' />
  <set label='David' value='42300' displayValue='Yearly best, $42.3K'/>
  <set label='Graham' value='35300' />
  <set label='John' value='31300' />
</chart>
{
  "chart":{
    "yaxisname":"Sales Figure",
    "caption":"Top 5 Sales Person",
    "numberprefix":"$",
    "useroundedges":"1",
    "bgcolor":"FFFFFF,FFFFFF",
    "showborder":"0",
    "basefontsize":"11"
  },
  "data":[{
      "label":"Alex",
      "value":"25000"
    },
    {
      "label":"Mark",
      "value":"35000"
    },
    {
      "label":"David",
      "value":"42300",
      "displayvalue":"Yearly best, $42.3K"
    },
    {
      "label":"Graham",
      "value":"35300"
    },
    {
      "label":"John",
      "value":"31300"
    }
  ]
}
This will result in the following. The tool-tip will, however, still show the numerical value (unless a custom tool-text is specified).
Modes for data values
The data values can be displayed on the chart in the following ways:
- Normal
- Rotated
In a column chart, you also have the option to place the data values either inside the column or outside it.
By default, FusionCharts XT shows the data values horizontally. But, you can rotate it by setting <chart rotateValues='1'>.
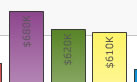
The data values can be placed inside the columns using <chart placeValuesInside='1'>. It yields the following result.
For better clarity, you can rotate the data values when placing them inside columns - <chart rotateValues='1' placeValuesInside='1'>
You can opt to show only specific data labels by using <chart showValues='0'> and then setting showValue='1' for the set you want to show the value. A chart having the same looks as under:
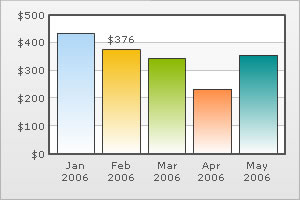
The XML/JSON going into the same is:
<chart numberPrefix='$' showValues='0'>
    <set label='Jan 2006' value='434' />
    <set label='Feb 2006' value='376' showValue='1'/>
    <set label='Mar 2006' value='343' />
    <set label='Apr 2006' value='234' />
    <set label='May 2006' value='356' />
</chart>
{
"chart":{
"numberprefix":"$",
"showvalues":"0"
},
"data":[{
"label":"Jan 2006",
"value":"434"
},
{
"label":"Feb 2006",
"value":"376",
"showvalue":"1"
},
{
"label":"Mar 2006",
"value":"343"
},
{
"label":"Apr 2006",
"value":"234"
},
{
"label":"May 2006",
"value":"356"
}
]
}
Using a single font property for all the values
If you want to specify a single font property for all the text on the chart, you can use the baseFont attribute group.
The following attributes are a part of this group:
| Attribute Name | Description | Example |
| baseFont | Lets you define the font family e.g., Arial, Verdana etc | baseFont='Verdana' |
| baseFontSize | Lets you define the font size (8-72) | baseFontSize='10' |
| baseFontColor | Lets you define the font color. Use hex code for the color without #. E.g., 000000 or 009933 or 999999 | baseFontColor='009933' |
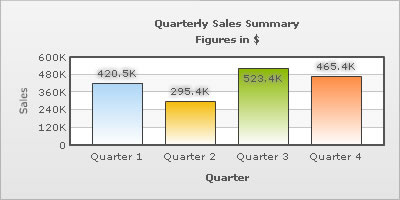
Example :
<chart caption='Quarterly Sales Summary' subcaption='Figures in $' xAxis='Quarter' yAxisName='Sales' baseFont='Arial' baseFontSize='12' baseFontColor='333333'>
   <set label='Quarter 1' value='420500' />
   <set label='Quarter 2' value='295400' />
   <set label='Quarter 3' value='523400' />
   <set label='Quarter 4' value='465400' />
</chart>
{
  "chart":{
    "caption":"Quarterly Sales Summary",
    "subcaption":"Figures in $",
    "xaxis":"Quarter",
    "yaxisname":"Sales",
    "basefont":"Arial",
    "basefontsize":"12",
    "basefontcolor":"333333"
  },
  "data":[{
      "label":"Quarter 1",
      "value":"420500"
    },
    {
      "label":"Quarter 2",
      "value":"295400"
    },
    {
      "label":"Quarter 3",
      "value":"523400"
    },
    {
      "label":"Quarter 4",
      "value":"465400"
    }
  ]
}
Output:
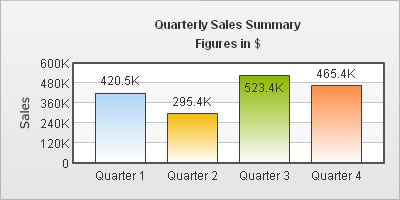
As you can see above, all the text in the chart has acquired the properties defined using the baseFont attribute group.
If you want the font properties for the text within the canvas (data values, tool tips) to be different from the font properties of the text outside the canvas, then you need to define both the baseFont and the outCnvBaseFont attribute groups. While the baseFont attribute group will set the attributes for all the text in the chart, outCnvbaseFont attribute group will over-ride the settings for the text outside the canvas, thus leaving the in-canvas text with different properties than the out-canvas text. The data for the same will be:
<chart caption='Quarterly Sales Summary' subcaption='Figures in $' xAxis='Quarter' yAxisName='Sales' baseFont='Arial' baseFontSize='12' baseFontColor='999999' outCnvbaseFontSize='10' outCnvBaseFontColor='333333'>
    <set label='Quarter 1' value='420500' />
    <set label='Quarter 2' value='295400' />
    <set label='Quarter 3' value='523400' />
    <set label='Quarter 4' value='465400' />
</chart>
{
  "chart":{
    "caption":"Quarterly Sales Summary",
    "subcaption":"Figures in $",
    "xaxis":"Quarter",
    "yaxisname":"Sales",
    "basefont":"Arial",
    "basefontsize":"12",
    "basefontcolor":"999999",
    "outcnvbasefontsize":"10",
    "outcnvbasefontcolor":"333333"
  },
  "data":[{
      "label":"Quarter 1",
      "value":"420500"
    },
    {
      "label":"Quarter 2",
      "value":"295400"
    },
    {
      "label":"Quarter 3",
      "value":"523400"
    },
    {
      "label":"Quarter 4",
      "value":"465400"
    }
  ]
}If you do not want all the text on your chart to have similar font properties, you can use Styles to define individual font properties for different text on the chart. Using Styles you can specify a different font name, size, color, background & border color and also make the text bold or italicized.
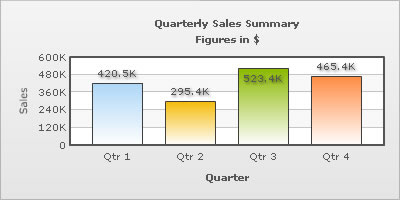
Shown below is a change in the font properties of the data values.
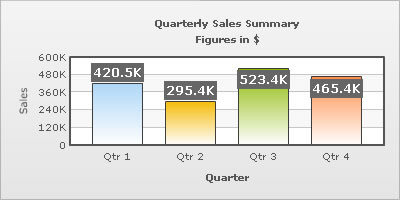
The XML/JSON for this chart is as under. To read more on Styles, please refer to FusionCharts XT Styles.
<chart caption='Quarterly Sales Summary' subcaption='Figures in $' xAxisName='Quarter' yAxisName='Sales'>
    <set label='Qtr 1' value='420500' />
    <set label='Qtr 2' value='295400' />
    <set label='Qtr 3' value='523400' />
    <set label='Qtr 4' value='465400' />
    <styles>
       <definition>
          <style name='myValuesFont' type='font' size='12' color='FFFFFF' bold='1' bgColor='666666' borderColor='666666'/>
       </definition>
       <application>
          <apply toObject='DataValues' styles='myValuesFont' />
       </application>
    </styles>
</chart>
{
"chart":{
"caption":"Quarterly Sales Summary",
"subcaption":"Figures in $",
"xaxisname":"Quarter",
"yaxisname":"Sales"
},
"data":[{
"label":"Qtr 1",
"value":"420500"
},
{
"label":"Qtr 2",
"value":"295400"
},
{
"label":"Qtr 3",
"value":"523400"
},
{
"label":"Qtr 4",
"value":"465400"
}
],
"styles": {
"definition": [
{
"name": "myValuesFont",
"type": "font",
"size": "12",
"color": "FFFFFF",
"bold": "1",
"bgcolor": "666666",
"bordercolor": "666666"
}
],
"application": [
{
"toobject": "DataValues",
"styles": "myValuesFont"
}
]
}
}You can also apply effects (shadow, glow, blur, bevel etc.) to the chart titles using Styles. Shown below is an example:
The XML/JSON for the same is:
<chart caption='Quarterly Sales Summary' subcaption='Figures in $' xAxisName='Quarter' yAxisName='Sales'>
   <set label='Qtr 1' value='420500' />
   <set label='Qtr 2' value='295400' />
   <set label='Qtr 3' value='523400' />
   <set label='Qtr 4' value='465400' />
   <styles>
      <definition>
         <style name='myShadow' type='Shadow' color='999999' angle='45'/>
      </definition>
      <application>
         <apply toObject='DataValues' styles='myShadow' />
      </application>
   </styles>
</chart>
{
"chart":{
"caption":"Quarterly Sales Summary",
"subcaption":"Figures in $",
"xaxisname":"Quarter",
"yaxisname":"Sales"
},
"data":[{
"label":"Qtr 1",
"value":"420500"
},
{
"label":"Qtr 2",
"value":"295400"
},
{
"label":"Qtr 3",
"value":"523400"
},
{
"label":"Qtr 4",
"value":"465400"
}
],
"styles": {
"definition": [
{
"name": "myShadow",
"type": "Shadow",
"color": "999999",
"angle": "45"
}
],
"application": [
{
"toobject": "DataValues",
"styles": "myShadow"
}
]
}
}We can also apply a glow to the data values as under:
The XML/JSON going into the above is:
<chart caption='Quarterly Sales Summary' subcaption='Figures in $' xAxisName='Quarter' yAxisName='Sales'>
    <set label='Quarter 1' value='420500' />
    <set label='Quarter 2' value='295400' />
    <set label='Quarter 3' value='523400' />
    <set label='Quarter 4' value='465400' />
    <styles>
       <definition>
          <style name='myGlow' type='Glow' color='9999999'/>
       </definition>
       <application>
          <apply toObject='DataValues' styles='myGlow' />
       </application>
    </styles>
</chart>
{
"chart":{
"caption":"Quarterly Sales Summary",
"subcaption":"Figures in $",
"xaxisname":"Quarter",
"yaxisname":"Sales"
},
"data":[{
"label":"Quarter 1",
"value":"420500"
},
{
"label":"Quarter 2",
"value":"295400"
},
{
"label":"Quarter 3",
"value":"523400"
},
{
"label":"Quarter 4",
"value":"465400"
}
],
"styles": {
"definition": [
{
"name": "myGlow",
"type": "Glow",
"color": "9999999"
}
],
"application": [
{
"toobject": "DataValues",
"styles": "myGlow"
}
]
}
}You can also apply animation effects to the data labels using Styles. Shown below is an example which animates the y-position of the data values from the top of the chart canvas to their respective positions.
<chart caption='Quarterly Sales Summary' subcaption='Figures in $' xAxisName='Quarter' yAxisName='Sales'>
   <set label='Quarter 1' value='420500' />
   <set label='Quarter 2' value='295400' />
   <set label='Quarter 3' value='523400' />
   <set label='Quarter 4' value='465400' />
   <styles>
      <definition>
         <style name='myAnim' type='animation' param='_y' start='$canvasStartY' duration='1' />
      </definition>
      <application>
         <apply toObject='DataValues' styles='myAnim' />
      </application>
   </styles>
</chart>
{
  "chart":{
    "caption":"Quarterly Sales Summary",
    "subcaption":"Figures in $",
    "xaxisname":"Quarter",
    "yaxisname":"Sales"
  },
  "data":[{
      "label":"Quarter 1",
      "value":"420500"
    },
    {
      "label":"Quarter 2",
      "value":"295400"
    },
    {
      "label":"Quarter 3",
      "value":"523400"
    },
    {
      "label":"Quarter 4",
      "value":"465400"
    }
  ],
 "styles": {
    "definition": [
      {
        "name": "myAnim",
        "type": "animation",
        "param": "_y",
        "start": "$canvasStartY",
        "duration": "1"
      }
    ],
    "application": [
      {
        "toobject": "DataValues",
        "styles": "myAnim"
      }
    ]
  }
}