Canvas refers to the area in which the chart is plotted.
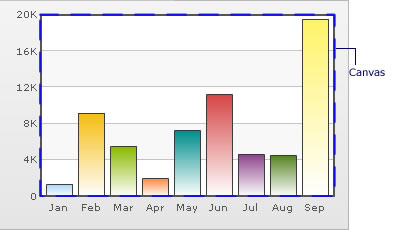
You can fill the canvas with solid or gradient color. The following attributes let you fill a solid color in the canvas:
| Attribute | Description | Example |
| canvasbgColor | Lets you set the background color for the Canvas. Use hex color code without #. To use a gradient fill, specify all the colors of the gradient separated by comma. | canvasbgColor='1D8BD1' |
| canvasbgAlpha | Lets you set the alpha (transparency) for canvas. | canvasbgAlpha='60' |
Example:
<chart ... canvasBgColor='CCCCCC' canvasBgAlpha='80' ...>
The 2D Charts have a border around the canvas as shown below:
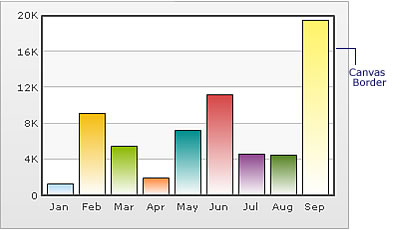
You can customize the canvas border using the attributes below:
| Attribute | Description | Example |
| canvasBorderColor | Lets you set the color for canvas border. | canvasBorderColor='1D8BD1' |
| canvasBorderThickness | Lets you set the thickness of canvas border (in pixels) | canvasBorderThickness='2' |
| canvasBorderAlpha | Lets you set the alpha for canvas border. | canvasBorderAlpha='60' |
Example:
<chart ... canvasBorderColor='666666' canvasBorderThickness='1' canvasBorderAlpha='80' ...>
You can also use gradients to fill the canvas. The following attributes let you do so:
| Attribute | Description | Example |
| canvasBgColor | To fill the canvas as gradient, you need to define two (or more) colors separated by comma. Use hex code of colors without specifying #. | canvasBgColor='1D8BD1,FFFFFF' |
| canvasBgAlpha | For each color code that you've specified in canvasbgColor attribute, you need to specify a respective alpha (transparency). Separate the alphas by comma. | canvasBgAlpha='40,100' |
| canvasBgRatio | Ratio of each color in the gradient on a scale of 100. The total ratios specified as this attribute should sum up to 100. For example, if you want to plot an equidistant gradient for 2 colors, specify canvasbgRatio as "0,100". | canvasBgRatio='40,60' |
| canvasBgAngle | Angle of the gradient fill (in degrees - 0-360). | canvasBgAngle='270' |
Example:
<chart canvasBgColor='FFFFFF,FF5904' canvasBgAlpha='100,40' canvasBgRatio='0,100' canvasBgAngle='180'>
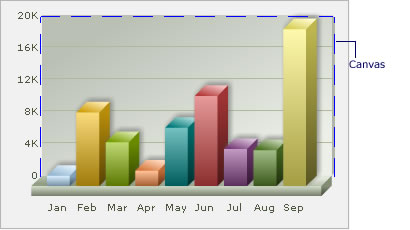
For 3D charts (and canvas), you've the following configuration properties:
| Attribute | Description | Example |
| showCanvasBg | Whether to show canvas background | showCanvasBg='1' |
| showCanvasBase | Whether to show canvas base | showCanvasBase='1' |
| canvasBaseDepth | Height of canvas base (in pixels) | canvasBaseDepth='10' |
| canvasBgDepth | Depth of Canvas Background | canvasBgDepth='3' |
Using Styles, you can apply effects like bevel, shadow, glow & blur to canvas. Shown below is an example where bevel (right side only) and shadow have been applied to canvas:
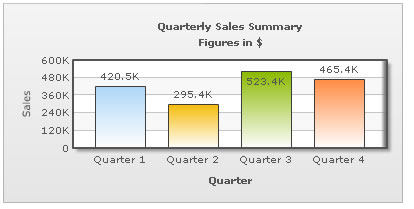
And the data for this can be listed as below:
<chart caption='Quarterly Sales Summary' subcaption='Figures in $' xAxisName='Quarter' yAxisName='Sales'>
    <set label='Quarter 1' value='420500' />
    <set label='Quarter 2' value='295400' />
    <set label='Quarter 3' value='523400' />
    <set label='Quarter 4' value='465400' />
    <styles>
        <definition>
            <style name='myBevel' type='Bevel' angle='0' />
            <style name='myShadow' type='Shadow' distance='5' angle='45'/>
        </definition>
        <application>
            <apply toObject='Canvas' styles='myBevel,myShadow' />
        </application>
    </styles>
</chart>
{
"chart":{
"caption":"Quarterly Sales Summary",
"subcaption":"Figures in $",
"xaxisname":"Quarter",
"yaxisname":"Sales"
},
"data":[{
"label":"Quarter 1",
"value":"420500"
},
{
"label":"Quarter 2",
"value":"295400"
},
{
"label":"Quarter 3",
"value":"523400"
},
{
"label":"Quarter 4",
"value":"465400"
}
],
"styles": {
"definition": [
{
"name": "myBevel",
"type": "Bevel",
"angle": "0"
},
{
"name": "myShadow",
"type": "Shadow",
"distance": "5",
"angle": "45"
}
],
"application": [
{
"toobject": "Canvas",
"styles": "myBevel,myShadow"
}
]
}
}You can similarly apply other effects too.
Using Styles, you can also animate the chart canvas. For example, the XML/JSON below renders the grow-effect to the 2D canvas. For 3D canvas, you can animate only _alpha property.
<chart caption='Quarterly Sales Summary' subcaption='Figures in $' xAxisName='Quarter' yAxisName='Sales'>
    <set label='Quarter 1' value='420500' />
    <set label='Quarter 2' value='295400' />
    <set label='Quarter 3' value='523400' />
    <set label='Quarter 4' value='465400' />
    <styles>
        <definition>
            <style name='myCanvasAnimX' type='Animation' param='_xScale' start='0' duration='1' />
            <style name='myCanvasAnimY' type='Animation' param='_yScale' start='0' duration='1' />
        </definition>
        <application>
            <apply toObject='Canvas' styles='myCanvasAnimX,myCanvasAnimY' />
        </application>
    </styles>
</chart>
{
"chart":{
"caption":"Quarterly Sales Summary",
"subcaption":"Figures in $",
"xaxisname":"Quarter",
"yaxisname":"Sales"
},
"data":[{
"label":"Quarter 1",
"value":"420500"
},
{
"label":"Quarter 2",
"value":"295400"
},
{
"label":"Quarter 3",
"value":"523400"
},
{
"label":"Quarter 4",
"value":"465400"
}
],
"styles": {
"definition": [
{
"name": "myCanvasAnimX",
"type": "Animation",
"param": "_xScale",
"start": "0",
"duration": "1"
},
{
"name": "myCanvasAnimY",
"type": "Animation",
"param": "_yScale",
"start": "0",
"duration": "1"
}
],
"application": [
{
"toobject": "Canvas",
"styles": "myCanvasAnimX,myCanvasAnimY"
}
]
}
}
Similarly, you can apply other animation effects to 2D canvas.