FusionCharts can effectively be used in ASP.NET.AJAX Update Panel to plot dynamic data-driven charts. In this example, we'll show a few basic examples to help you get started.
We'll cover the following examples here:
- We'll use FusionCharts in an Update Panel taking data from a database.
- We'll then create 2 FusionCharts in a page, in which one chart controls the other chart in an Update panel.
Let's quickly see each of them.
Before you go further with this page, we recommend you to please see the previous sections "Basic Examples" and other subsequent pages as we start off from concepts explained in that page.
You need to rename the given web.config.ajax to web.config to incorporate the ASP.NET.AJAX extension.
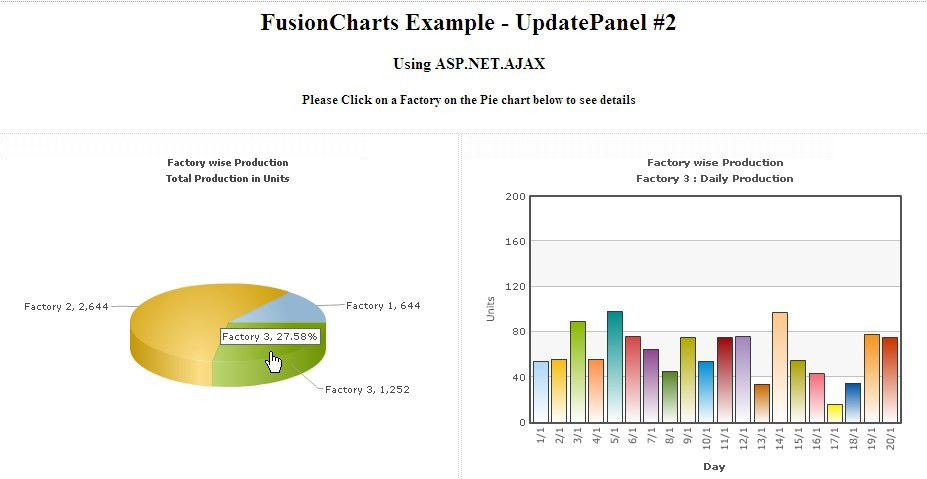
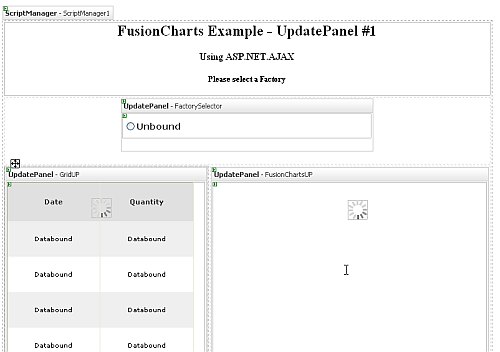
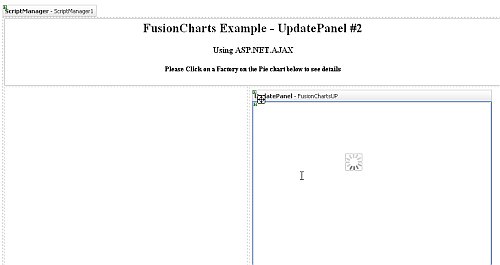
We will create 3 UpdatePanels:
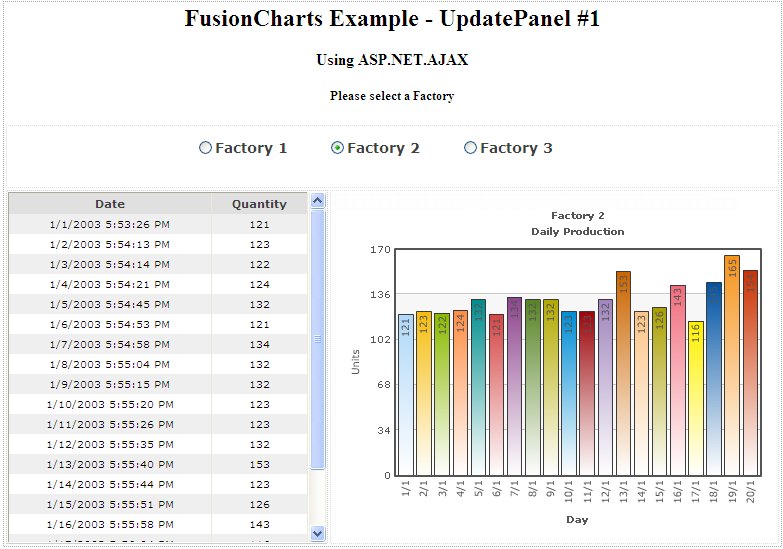
- First on top with RadioButtonList control to select Factory Name (id - FactorySelector)
- Left - with a GridView control showing selected Factory's output data -(id - GridUP)
- Right - with a Column2D chart (using FusionCharts) to show factory output data (id - FusionChartsUP)
The design view will look like this :
<ContentTemplate>
<asp:RadioButtonList ID="RadioButtonList1" runat="server" AutoPostBack="True" Height="40px"
OnSelectedIndexChanged="RadioButtonList1_SelectedIndexChanged" Width="400px"
RepeatDirection="Horizontal" Style="font-weight: bold; font-size: 14px; font-family: Verdana"
ForeColor="#404040">
</asp:RadioButtonList>
</ContentTemplate>
</asp:UpdatePanel>
<ContentTemplate>
<asp:Panel ID="Panel1" runat="server" Height="350px" Width="440px">
</asp:Panel>
s </ContentTemplate>
</asp:UpdatePanel>
Protected Sub RadioButtonList1_SelectedIndexChanged(ByVal sender As Object, ByVal e As EventArgs)
'Update FusionCharts and gridview with as per selected factory
updateChart()
End Sub
Private Sub updateChart()
'Get factory details depending on FactoryID from selected Radio Button
Dim strSQL As String = "select DatePro, Quantity from Factory_Output where FactoryId=" & RadioButtonList1.SelectedValue.ToString() & " order by DatePro"
'Create data reader to bind data with GridView
Dim rs As New DbConn(strSQL)
'Fillup gridview with data from datareader
GridView1.DataSource = rs.ReadData
' binding the data
GridView1.DataBind()
'Create database connection to get data for chart
Dim oRs As New DbConn(strSQL)
'Create FusionCharts XML
Dim strXML As New StringBuilder()
'Create chart element
strXML.Append("<chart caption='Factory " & RadioButtonList1.SelectedValue.ToString() & "' showborder='0' bgcolor='FFFFFF' bgalpha='100' subcaption='Daily Production' xAxisName='Day' yAxisName='Units' rotateLabels='1' placeValuesInside='1' rotateValues='1' >")
'Iterate through database
While oRs.ReadData.Read()
'Create set element
'Also set date into d/M format
strXML.Append("<set label='" & Convert.ToDateTime(oRs.ReadData("DatePro")).ToString("d/M") & "' value='" & oRs.ReadData("Quantity").ToString() & "' />")
End While
'Close chart element
strXML.Append("</chart>")
'outPut will store the HTML of the chart rendered as string
Dim outPut As String = ""
If IsPostBack = True Then
'when an ajax call is made we use RenderChartHTML method
outPut = FusionCharts.RenderChartHTML("../FusionCharts/Column2D.swf", "", strXML.ToString(), "chart1", "445", "350", False, False)
Else
'When the page is loaded for the first time, we call RenderChart() method to avoid IE's 'Click here to Activate...' message
outPut = FusionCharts.RenderChart("../FusionCharts/Column2D.swf", "", strXML.ToString(), "chart1", "445", "350", False, False)
End If
'Clear panel which will contain the chart
Panel1.Controls.Clear()
'Add Literal control to Panel which adds the chart from outPut string
Panel1.Controls.Add(New LiteralControl(outPut))
' close Data Reader
oRs.ReadData.Close()
End Sub
In the above code we do the following :
- Open database connection to get data for the selected factory
- Update the GridView control with data from database
- Create the chart XML
- Use InfoSoftGlobal.FusionCharts.RenderChartHTML method to generate HTML for the chart to be displayed
- Update the Panel control in the FusionChartsUP UpdatePanel with this HTML for the chart
Let's see how the design is modified :(Sample2.aspx)
//Call Ajax PostBack Function
function updateChart(factoryId){
//Call drillDown C# function by Ajax
//we pass the name of the function ('drillDown') to call
//and the parameter (i.e., factoryId) to be passed to it
//both separated by a delimiter(here we use $, you can use anything)
__doPostBack("Panel1","drillDown$" + factoryId);
}
</script>
Private Sub Page_Load(ByVal sender As Object, ByVal e As System.EventArgs) Handles Me.Load
'This will execute first time the page loads and not on ajax post back calls
If IsPostBack = False Then
' Show a blank Column2D Chart at first
showColumnChart()
Else
' Handle Ajax PostBack Call
' store Asp.Net Ajax special HTTP request
' __EVENTARGUMENT holds value passed by JS function -__doPostBack
' The value can be like "drillDown$1"
'We take $ as delimiter so we get drillDown as the function to call
'and 1 as the factory id. It can vary depending on the pie slice clicked.
Dim sEventArguments As String = Request("__EVENTARGUMENT")
If sEventArguments <> "" Then
'extract arguments passed to the HTTP Request
Dim iDelimiter As Integer = sEventArguments.IndexOf("$")
Dim sArgument As String = sEventArguments.Substring(iDelimiter + 1)
' extract the name of the post back function
If sEventArguments.StartsWith("drillDown") = True Then
' call the post back function passing the argument(s)
drillDown(sArgument)
End If
End If
End If
End Sub
The above code is executed whenever a page is loaded be is at first or through AJAX call. It does the following :
- It loads a blank Column2D chart on first load calling function showColumnChart()
- On post-back calls it parses the __EVENTARGUMENT request and extract the name of the function to be called and argument to be passed to the function. Here the argument will be the Factory Id.
- Accordingly the function name that the request gives is DrillDown and is called.
- DrillDown() function is same as the updateChart() function of the previous example, which creates chart XML as per the selected Factory and sets the panel with the chart HTML created using InfoSoftGlobal.FusionCharts.RenderChartHTML function.