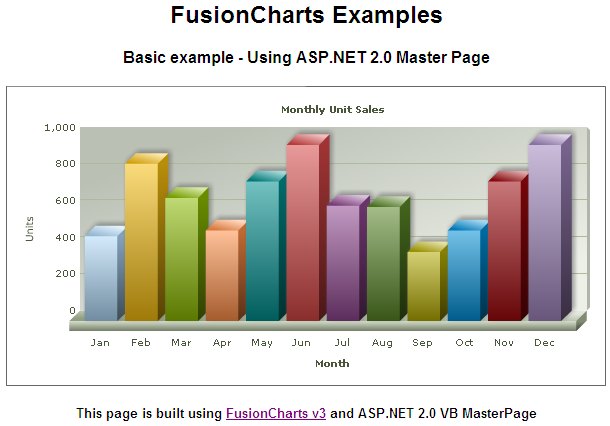
FusionCharts can effectively be used with VB (ASP.NET) Master Pages to plot dynamic data-driven charts. In this example, we'll show a basic sample to help you get started.
In this example we'll do the following:
- We'll create a simple master page.
- We'll define a content page for this master page
- We'll place a chart in this content page.
Before you go further with this page, we recommend you to please see the previous section "Basic Examples" as we start off from concepts explained in that page.
<html>
<head runat="server">
<style type="text/css">
<!--
body { font-family: Arial, Helvetica, sans-serif; font-size: 12px; }
.text{ font-family: Arial, Helvetica, sans-serif; font-size: 12px; }
-->
</style>
</head>
<body>
<center>
<form id='form2' name='form1' method='post' runat="server">
<h2>FusionCharts Examples</h2>
<h4>Basic example - Using ASP.NET 2.0 Master Page</h4>
<asp:ContentPlaceHolder ID="ContentPlaceHolder1" runat="server">
</asp:ContentPlaceHolder>
<p />
<h5>
This page is built using <a href="http://www.fusioncharts.com" target="_blank">
FusionCharts v3</a> and ASP.NET 2.0 VB MasterPage
</h5>
</form>
</center>
</body>
</html>
- We have added the header and footer text.
- We placed a content holder with id ContentPlaceHolder1. Inside this we will place our chart from the main aspx file.
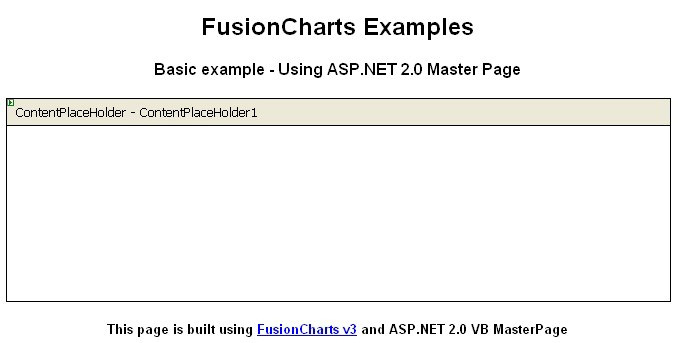
The master page will look like the following in Design view:
<asp:Content ID="Content1" ContentPlaceHolderID="ContentPlaceHolder1" Runat="Server">
<script language="javascript" type="text/javascript" src="../FusionCharts/FusionCharts.js"></script>
<%
'Included FusionCharts.js to embed FusionCharts easily in web pages
'The following code will generate a chart from code behind file Default.aspx.cs
%>
<%=GetMonthlySalesChartHtml() %>
</asp:Content>
- Here, we set MasterPageFile attribute to bind the master page we just created.
- Next, we add the Content control and map it to ContentPlaceHolder control on the master page.
- Inside the content we include FusionCharts.js to easily embed a chart.
- Finally, we call GetMonthlySalesChartHtml() from code behind file which renders the chart.
Imports InfoSoftGlobal
Partial Class _Default
Inherits System.Web.UI.Page
Public Function GetMonthlyalesChartHtml() As String
'Create the chart - Column 3D Chart with data from Data/Data.xml
Return FusionCharts.RenderChart("../FusionCharts/Column3D.swf", "Data/Data.xml", "", "myFirst", "600", "300", False, True)
End Function
End Class
We've just used the RenderChart() method from InfoSoftGlobal.FusionCharts class to return the HTML code for the chart (using JavaScript embedding). For simplicity we have used a physical Data.xml file to provide chart data using dataURL method.