In our previous example, we had combined FusionCharts, ASP.NET and JavaScript to create client side dynamic charts. We were updating the chart by asking it to fetch new data from server and update itself, without incurring any page refreshes.
In this example, instead of asking the chart to get XML data from server, we'll provide updated XML data to chart using JavaScript functions. The chart will simply accept that XML data and render.
This method can effectively be used in your AJAX applications, where your JavaScript code gets the updated XML from server and then provides it to charts locally. You can process the data received from AJAX Calls, build XML from it and finally provide it to the chart.
Before you proceed with the contents in this page, we strictly recommend you to please go through the sections "How FusionCharts works?" and "Basic Examples", as we'll directly use a lot of concepts defined in those sections.
The code discussed in this example is present in Download Package > Code > VB_NET > DB_JS folder.
We'll carry on from our previous example and convert it to use JavaScript + XML, so that the new XML is provided to the chart using JavaScript functions - the charts NO more directly request data from server. To attain this, we send all the pertinent data from our server to the end viewer as JavaScript arrays in the same page. The JavaScript arrays are dynamically generated by ASP.NET pages at run-time and filled with data.
Effectively, we will do the following:
- Contain both the pie chart (summary) and column chart (detailed) in one page (Default.aspx).
- When the page loads, the pie chart would use dataXML method to show summary of all factories. This data will be built in Default.aspx itself.
- There will be a JavaScript array named as data in this page. This array will contain detailed data for the factories. The array will be dynamically built using ASP.NET and then outputted as JavaScript code.
- Apart from the data in JavaScript, we'll also have a local JavaScript function updateChart(), which would process the data in this array and convert it to XML data document, for direct usage by the column chart.
- The column chart would initialize with no data, as the user has not selected a factory initially. We'll customize the "No data to display" message of the chart to show a friendly message.
- The pie chart would have JavaScript links defined for each pie slice. This JavaScript links refer to updateChart() JavaScript function present on the same page. We'll later see how to hand code this function. When a pie is clicked, the factory ID is passed to this function.
- The updateChart() function is responsible for updating the column chart. It generates the XML data from data stored in JavaScript data array and conveys it to the column chart.
- The column chart would now accept this XML data, parse it and finally render.
<%@ Page Language="VB" AutoEventWireup="false" CodeFile="Default.aspx.vb" Inherits="DB_JS_Default" %>
<HTML>
<HEAD>
<TITLE>FusionCharts - Database + JavaScript Example
</TITLE>
<SCRIPT LANGUAGE="Javascript"
SRC="../FusionCharts/FusionCharts.js">
</SCRIPT>
<SCRIPT LANGUAGE="JavaScript">
//Here, we use a mix of server side script (VB.NET) and JavaScript to
//render our data for factory chart in JavaScript variables. We'll
later
//utilize this data to dynamically plot charts.
//All our data is stored in the data array. From VB.NET, we iterate
through
//each recordset of data and then store it as nested arrays in this
data array.
var data = new Array();
//Write the data as JavaScript variables here
<%=GetScript()%>
//The data is now present as arrays in JavaScript. Local JavaScript
functions
//can access it and make use of it. We'll see how to make use of
it.
/**
* updateChart method is invoked when the user clicks on a pie
slice.
* In this method, we get the index of the factory, build the XML
data
* for that that factory, using data stored in data array, and
finally
* update the Column Chart.
* @param factoryIndex Sequential Index of the factory.
*/
function updateChart(factoryIndex){
//Storage for XML data document
var strXML = "<chart palette='2' caption='Factory " +
factoryIndex + " Output ' subcaption='(In Units)' xAxisName='Date'
showValues='1' labelStep='2' >";
//Add <set> elements
var i=0;
for (i=0; i<data[factoryIndex].length; i++){
strXML = strXML + "<set label='" +
data[factoryIndex][i][0] + "' value='" + data[factoryIndex][i][1] + "' />";
}
//Closing Chart Element
strXML = strXML + "</chart>";
//Get reference to chart object using Dom ID
"FactoryDetailed"
var chartObj = getChartFromId("FactoryDetailed");
//Update its XML
chartObj.setXMLData(strXML);
}
</SCRIPT>
</HEAD>
<body>
<form id='form1' name='form1' method='post' runat="server">
<asp:Literal ID="Literal1" runat="server"></asp:Literal>
<BR>
<asp:Literal ID="Literal2" runat="server"></asp:Literal>
</form>
</body>
</HTML>
Code in code behind page:
'In this example, we show a combination of database + JavaScript
rendering using FusionCharts.
'The entire app (page) can be summarized as under. This app shows the
break-down
'of factory wise output generated. In a pie chart, we first show the sum
of quantity
'generated by each factory. These pie slices, when clicked would show
detailed date-wise
'output of that factory.
'The XML data for the pie chart is fully created in ASP.NET at run-time.
ASP.NET interacts
'with the database and creates the XML for this.
'Now, for the column chart (date-wise output report), we do not submit
request to the server.
'Instead we store the data for the factories in JavaScript arrays. These
JavaScript
'arrays are rendered by our ASP.NET Code (at run-time). We also have a
few defined JavaScript
'functions which react to the click event of pie slice.
'We've used an Access database which is present in ../DB/FactoryDB.mdb.
'It just contains two tables, which are linked to each other.
'Before the page is rendered, we need to connect to the database and get
the
'data, as we'll need to convert this data into JavaScript variables.
Public Function GetScript() As String
'String to store JavaScript variables
Dim jsVarString As New StringBuilder()
'Generate SQL querystring to get all factory Ids
Dim factoryQuery As String = "select FactoryId from Factory_Master"
'Sets JavaScript Array Index
Dim indexCount As Integer = 0
'Create a table to store factoryIds
Dim oRs As New DbConn(factoryQuery)
'Iterate through each record
While oRs.ReadData.Read()
indexCount = indexCount + 1
'Build JavaScript : Create a new JavaScript Array
jsVarString.Append("" & vbTab & vbTab & " data[" & indexCount.ToString() & "] = new Array();" & Environment.NewLine)
'Create an SQL Query for the current FactoryId
Dim outputQuery As String = "select DatePro, Quantity from Factory_Output where FactoryId=" & oRs.ReadData("FactoryId").ToString & " order by DatePro Asc"
'Create a table storing detailed Factory Data
Dim oRs1 As New DbConn(outputQuery)
'Iterate Through records
While oRs1.ReadData.Read()
'Build JavaScript : Push Factory Data into JavaScript Array
'Convert date into specific dd/MM format
jsVarString.Append("" & vbTab & vbTab & " data[" & indexCount.ToString & "].push(new Array('" & Convert.ToDateTime(oRs1.ReadData("DatePro")).ToString("dd/MM") & "'," & oRs1.ReadData("Quantity").ToString & "));" & Environment.NewLine)
End While
oRs1.ReadData.Close()
End While
oRs.ReadData.Close()
'Returns JavaScript variables
Return jsVarString.ToString()
End Function
Public Function GetFactorySummayChartHtml() As String
'Initialize the Pie chart with sum of production for each of the
factories
'xmlData will be used to store the entire XML document generated
Dim xmlData As New StringBuilder()
'Generate the chart element
xmlData.Append("<chart caption='Factory Output report' subCaption='By Quantity' pieSliceDepth='30' showBorder='1' formatNumberScale='0' numberSuffix=' Units'>")
'create recordset to get details for the factories
Dim factoryQuery As String = "select a.FactoryId, a.FactoryName, sum(b.Quantity) as TotQ from .Factory_Master a, Factory_Output b where a.FactoryId=b.FactoryID group by a.FactoryId, a.FactoryName"
Dim oRs As New DbConn(factoryQuery)
'Iterate through each record
While oRs.ReadData.Read()
'Generate <set label='..' value='..' link='...'/>
'The link causes drill-down by calling (here) a JavaScript function
'The function is passed the Factory id
'The function updates the second chart
xmlData.Append("<set label='" & oRs.ReadData("FactoryName").ToString() & "' value='" & oRs.ReadData("TotQ").ToString & "'link='JavaScript:updateChart(" & oRs.ReadData("FactoryId").ToString() & ")' />")
End While
oRs.ReadData.Close()
'Close chart element
xmlData.Append("</chart>")
'Create the chart - Pie 3D Chart with data from xmlData
Return FusionCharts.RenderChart("../FusionCharts/Pie3D.swf", "", xmlData.ToString(), "FactorySum", "500", "250", False, True)
End Function
Public Function GetFactoryDetailedChartHtml() As String
'Column 2D Chart with changed "No data to display" message
'We initialize the chart with <chart></chart> Return
FusionCharts.RenderChart("../FusionCharts/Column2D.swf?ChartNoDataText=Please select a factory from pie chart above to view " & "detailed data.", "", "<chart></chart>", "FactoryDetailed", "600", "250", False, True)
End Function
Protected Sub Page_Load(ByVal sender As Object, ByVal e As System.EventArgs) Handles Me.Load
Literal1.Text = GetFactorySummaryChartHtml()
Literal2.Text = GetFactoryDetailedChartHtml()
End Sub
In this page, before rendering any HTML code, we first generate all the data in database as JavaScript array. To do so, we use string concatenation in ASP.NET variables to store all data as JavaScript array code. Once the JavaScript code is built in our ASP.NET variable, we write it out in the <SCRIPT> section of HTML <HEAD>.
<SCRIPT LANGUAGE="JavaScript">
  var data = new Array();
  <%
  <%=GetScript()%>
  %>
</SCRIPT>
If you run this page and view the source JavaScript code, you'll see the following:
var data = new Array();

data[1] = new Array();
data[1].push(new Array('1/1',21));
data[1].push(new Array('2/1',23));
data[1].push(new Array('3/1',22));
data[1].push(new Array('4/1',24));
data[1].push(new Array('5/1',32));
data[1].push(new Array('6/1',21));
data[1].push(new Array('7/1',34));
data[1].push(new Array('8/1',32));
data[1].push(new Array('9/1',32));
data[1].push(new Array('10/1',23));
data[1].push(new Array('11/1',23));
data[1].push(new Array('12/1',32));
data[1].push(new Array('13/1',53));
data[1].push(new Array('14/1',23));
data[1].push(new Array('15/1',26));
data[1].push(new Array('16/1',43));
data[1].push(new Array('17/1',16));
data[1].push(new Array('18/1',45));
data[1].push(new Array('19/1',65));
data[1].push(new Array('20/1',54));
data[2] = new Array();
data[2].push(new Array('1/1',121));
data[2].push(new Array('2/1',123));
data[2].push(new Array('3/1',122));
data[2].push(new Array('4/1',124));
data[2].push(new Array('5/1',132));
data[2].push(new Array('6/1',121));
data[2].push(new Array('7/1',134));
data[2].push(new Array('8/1',132));
data[2].push(new Array('9/1',132));
data[2].push(new Array('10/1',123));
data[2].push(new Array('11/1',123));
data[2].push(new Array('12/1',132));
data[2].push(new Array('13/1',153));
data[2].push(new Array('14/1',123));
data[2].push(new Array('15/1',126));
data[2].push(new Array('16/1',143));
data[2].push(new Array('17/1',116));
data[2].push(new Array('18/1',145));
data[2].push(new Array('19/1',165));
data[2].push(new Array('20/1',154));
data[3] = new Array();
data[3].push(new Array('1/1',54));
data[3].push(new Array('2/1',56));
data[3].push(new Array('3/1',89));
data[3].push(new Array('4/1',56));
data[3].push(new Array('5/1',98));
data[3].push(new Array('6/1',76));
data[3].push(new Array('7/1',65));
data[3].push(new Array('8/1',45));
data[3].push(new Array('9/1',75));
data[3].push(new Array('10/1',54));
data[3].push(new Array('11/1',75));
data[3].push(new Array('12/1',76));
data[3].push(new Array('13/1',34));
data[3].push(new Array('14/1',97));
data[3].push(new Array('15/1',55));
data[3].push(new Array('16/1',43));
data[3].push(new Array('17/1',16));
data[3].push(new Array('18/1',35));
data[3].push(new Array('19/1',78));
data[3].push(new Array('20/1',75));
You can clearly see that our ASP.NET code has outputted JavaScript code that can now locally create an array and feed it with requisite data.
Now, before we get to the JavaScript functions, let's first see what we're doing in our ASP.NET Code.
We first create the XML data document for Pie chart - summary of factory output. For each <set>, we provide a JavaScript link to the updateChart() function and pass the factory ID to it as shown in the line below:
xmlData.Append("<set label='" & oRs.ReadData("FactoryName").ToString() & "' value='" & oRs.ReadData("TotQ").ToString & "'link='JavaScript:updateChart(" & oRs.ReadData("FactoryId").ToString() & ")' />")
We now render the Pie 3D chart using dataXML method. The Pie 3D chart has its
DOM Id as
FactorySum:
FusionCharts.RenderChart("../FusionCharts/Pie3D.swf", "", xmlData, "FactorySum", 500, 250, false, false)
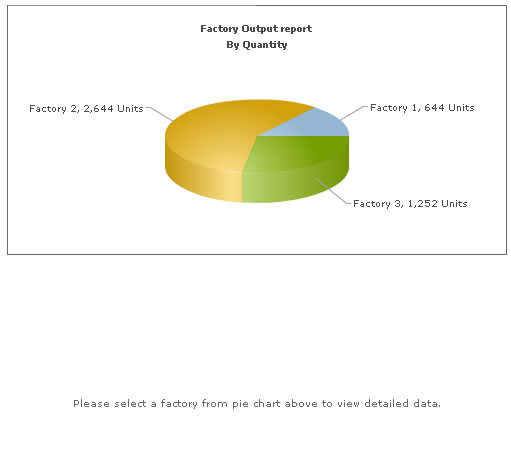
Now, we render an empty Column 2D chart with <chart></chart> data initially. We also change the "No data to display." error to a friendly and intuitive "Please select a factory from pie chart above to view detailed data." This chart has its DOM Id as FactoryDetailed.
FusionCharts.RenderChart("../FusionCharts/Column2D.swf?ChartNoDataText=Please select a factory from pie chart above to view detailed data.", "", "<chart></chart>", "FactoryDetailed", 600, 250, false, false)
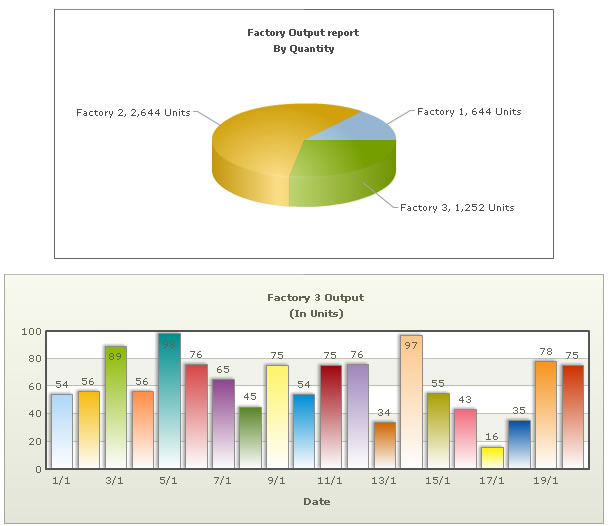
Effectively, our page is now set to show two charts. The pie chart shows the summary data provided to it using dataXML method. The column chart shows the above "friendly" error message. Now, when each pie slice is clicked, the updateChart() JavaScript function is called and the factoryID of the pie is passed to it. This function is responsible for updating the column chart and contains the following code:
function updateChart(factoryIndex){
//Storage for XML data document
var strXML = "";
//Add elements
var i=0;
for (i=0; i<data[factoryIndex].length; i++){
strXML = strXML + " ";
//Get reference to chart object using Dom ID "FactoryDetailed"
var chartObj = getChartFromId("FactoryDetailed");
//Update its XML
chartObj.setXMLData(strXML);
}
Here,
- We first create the XML data document for the column chart by iterating through data contained in our JavaScript data array.
- Thereafter, we convey this XML data to the column chart. To do so, we first get a reference to the column chart using its DOM Id FactoryDetailed. We use the getChartFromId() function defined in FusionCharts.js to do so.
- Once we've the reference to the chart, we simply call the setXMLData method of the chart and pass it the XML data document.
- This updates the chart with new data.
When you now see the application, the initial state would look as under:
And when you click on a pie slice, the following would appear on the same page (without involving any browser refreshes):
This example demonstrated a very basic sample of the integration capabilities possible with FusionCharts v3. For advanced demos, you can see and download our FusionCharts Blueprint/Demo Applications.