In our previous example, we had used FusionCharts to plot a chart using data stored in database. We'll now extend that example itself to create a drill-down chart which can show more information.
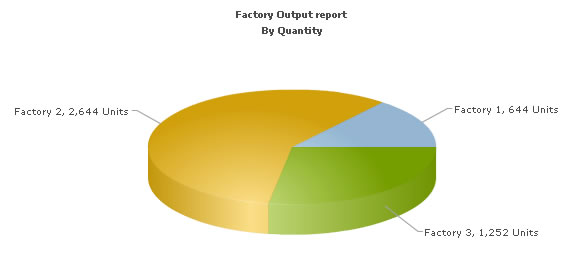
If you recall from previous example, we were showing the sum of factory output in a pie chart as under:
<%@ Page Language="VB" AutoEventWireup="false" CodeFile="Default.aspx.vb" Inherits="DBExample_Default" %>
<HTML>
<HEAD>
<TITLE>FusionCharts - Database Example </TITLE>
<SCRIPT LANGUAGE="Javascript"
SRC="../FusionCharts/FusionCharts.js"></SCRIPT>
</HEAD>
<body>
<form id='form1' name='form1' method='post' runat="server">
<asp:Literal ID="Literal1" runat="server"></asp:Literal>
</form>
</body>
</HTML>
Protected Sub Page_Load(ByVal sender As Object, ByVal e As System.EventArgs) Handles Me.Load
'xmlData will be used to store the entire XML document generated
Dim xmlData As New StringBuilder()
'We also keep a flag to specify whether we've to animate the chart or not.
'If the user is viewing the detailed chart and comes back to this page, he shouldn't
'see the animation again.
Dim animateChart As String
animateChart = Request("animate")
'Set default value of 1
If ((Not (animateChart) Is Nothing) AndAlso (animateChart.Length = 0)) Then
animateChart = "1"
End If
'Generate the chart element
xmlData.Append("<chart caption='Factory Output report' subCaption='By Quantity' pieSliceDepth='30' showBorder='1' formatNumberScale='0' numberSuffix=' Units' animation=' " & animateChart & "'>")
'create recordset to get details for the factories
Dim factoryQuery As String = "select a.FactoryId, a.FactoryName, sum(b.Quantity) as TotQ from .Factory_Master a, Factory_Output b where a.FactoryId=b.FactoryID group by a.FactoryId, a.FactoryName"
Dim oRs As New DbConn(factoryQuery)
'Iterate through each record
While oRs.ReadData.Read()
'Generate <set label='...' value='...' link='...'/>
'The link causes drill-down by loading a another page
'The page is passed the factoryId
'Accordingly the page creates a detailed chart against that FactoryId
xmlData.Append("<set label='" & oRs.ReadData("FactoryName").ToString() & "' value='" & oRs.ReadData("TotQ").ToString() & "' link='" & Server.UrlEncode("Detailed.aspx?FactoryId=" & oRs.ReadData("FactoryId").ToString()) & "'/>")
End While
oRs.ReadData.Close()
'Finally, close <chart> element
xmlData.Append("</chart>")
'Create the chart - Pie 3D Chart with data from xmlData
Literal1.Text = FusionCharts.RenderChart("../FusionCharts/Pie3D.swf", "", xmlData.ToString(), "FactorySum", "600", "300", False, False)
End Function
As you can see in the code above, we're doing the following:
- Include FusionCharts.js JavaScript class to enable easy embedding of FusionCharts.
- We then open a connection to Access database.
- Thereafter, we generate the XML data in the GetFactorySummaryChartHtml() method document by iterating through the recordset. We store the XML data in xmlData variable. To each <set> element, we add the link attribute, which points to Detailed.aspx - the page that contains the chart to show details. We pass the factory id of the respective factory by appending it to the link. We finally Url Encode the link, which is a very important step.
- Finally, we render the chart using RenderChart() method and pass xmlData as dataXML.
Let's now shift our attention to Detailed.aspx page.
<%@ Page Language="VB" AutoEventWireup="false" CodeFile="Detailed.aspx.vb" Inherits="DBExample_Detailed" %>
<HTML>
<HEAD>
<TITLE>FusionCharts - Database and Drill-Down Example </TITLE>
<SCRIPT LANGUAGE="Javascript"
SRC="../../FusionCharts/FusionCharts.js"></SCRIPT>
</HEAD>
<body>
<form id='form1' name='form1' method='post' runat="server">
<asp:Literal ID="Literal1" runat="server"></asp:Literal>
</form>
</body>
</HTML>
Protected Sub Page_Load(ByVal sender As Object, ByVal e As System.EventArgs) Handles Me.Load
'This page is invoked from Default.aspx. When the user clicks on a pie
'slice in Default.aspx, the factory Id is passed to this page. We need
'to get that factory id, get information from database and then show
'a detailed chart.
'First, get the factory Id
Dim factoryId As String
'Request the factory Id from Querystring
factoryId = Request("FactoryId")
'xmlData will be used to store the entire XML document generated
Dim xmlData As New StringBuilder()
'Generate the chart element string
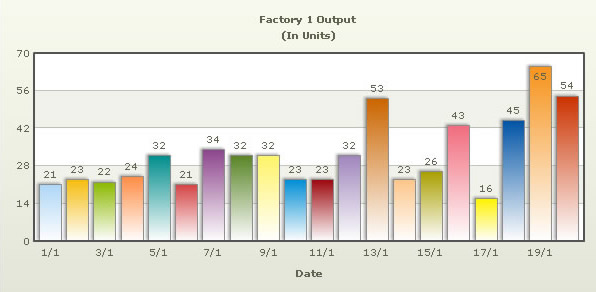
xmlData.Append("<chart palette='2' caption='Factory " & factoryId & " Output ' subcaption='(In Units)' xAxisName='Date (dd/MM)' showValues='1' labelStep='2' >")
'Now, we get the data for that factory
Dim query As String = "select DatePro, Quantity from Factory_Output where FactoryId=" & factoryId
Dim oRs As New DbConn(query)
'Iterate through each record
While oRs.ReadData.Read()
'Convert date from database into dd/mm format
'Generate <set label='..' value='..' />
xmlData.Append("<set label='" & Convert.ToDateTime(oRs.ReadData("DatePro")).ToString("dd/MM") & "' value='" & oRs.ReadData("Quantity").ToString() & "'/>")
End While
oRs.ReadData.Close()
'Close <chart> element
xmlData.Append("</chart>")
'Create the chart - Column 2D Chart with data from xmlData
Literal1.Text = FusionCharts.RenderChart("../FusionCharts/Column2D.swf", "", xmlData.ToString(), "FactoryDetailed", "600", "300", False, False)
End Function
In this page, we're:
- Including FusionCharts.js JavaScript class to enable easy embedding of FusionCharts.
- Requesting the factory id for which we've to show detailed data. This data was sent to us as querystring, as a part of pie chart link.
- We get the requisite data for this factory from database and then convert it into XML using string concatenation.
- Finally, we render a Column 2D chart using RenderChart() method to show detailed data.
When you now run the app, you'll see the detailed page as under: