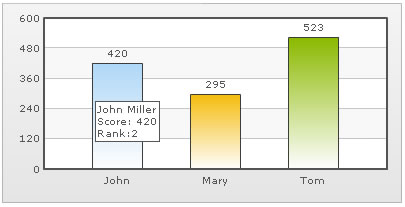
By default, if your tool-tips are larger than the chart width, FusionCharts will automatically wrap them. However, if you want to add manual breaks to the content of your tool-text, you can do so as under:
<chart>
   <set label='John' value='420' tooltext='John Miller{br}Score: 420{br}Rank:2'/>
   <set label='Mary' value='295' tooltext='Mary Evans{br}Score: 295{br}Rank:3'/>
   <set label='Tom' value='523' tooltext='Tom Bowler{br}Score: 523{br}Rank:1'/>
</chart>
{
"chart":{},
"data":[{
"label":"John",
"value":"420",
"tooltext":"John Miller{br}Score: 420{br}Rank:2"
},
{
"label":"Mary",
"value":"295",
"tooltext":"Mary Evans{br}Score: 295{br}Rank:3"
},
{
"label":"Tom",
"value":"523",
"tooltext":"Tom Bowler{br}Score: 523{br}Rank:1"
}
]
}
In the above data, to add a line break in the tool-tip, we've used the pseudo code {br}.
When you now see the chart, you'll get the following output:
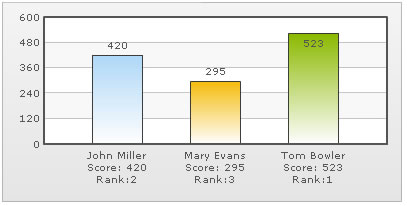
Similarly, you can apply line breaks to your data labels also. Consider the XML/JSON below:
<chart>
   <set label='John Miller{br}Score: 420{br}Rank:2' value='420' />
   <set label='Mary Evans{br}Score: 295{br}Rank:3' value='295' />
   <set label='Tom Bowler{br}Score: 523{br}Rank:1' value='523' />
</chart>
{
  "chart": {},
  "data": [
    {
      "label": "John Miller{br}Score: 420{br}Rank:2",
      "value": "420"
    },
    {
      "label": "Mary Evans{br}Score: 295{br}Rank:3",
      "value": "295"
    },
    {
      "label": "Tom Bowler{br}Score: 523{br}Rank:1",
      "value": "523"
    }
  ]
}
The above XML will now render the following chart: