Currency symbols, e.g., £(Pound), €(Euro), ¥(Yen) etc., may also be a part of the data which is displayed on charts. This section guides you on how to include the most used currency symbols as a part of your charts.
To display Pound character on a chart, you can simply include it in the XML/JSON data source of the chart. This is applicable in both Data Url and Data String methods.
Following data includes the £ character:
<chart showValues="1" caption="Revenue for 2009" numberPrefix="£" xAxisName="Quarter" yAxisName="Revenue" >
    <set value="235000" label="Quarter 1"/>
    <set value="125100" label="Quarter 2"/>
    <set value="334200" label="Quarter 3"/>
    <set value="414500" label="Quarter 4"/>
</chart>
{
  "chart":{
    "showvalues":"1",
    "caption":"Revenue for 2009",
    "numberprefix":"£",
    "xaxisname":"Quarter",
    "yaxisname":"Revenue"
  },
  "data":[{
      "value":"235000",
      "label":"Quarter 1"
    },
    {
      "value":"125100",
      "label":"Quarter 2"
    },
    {
      "value":"334200",
      "label":"Quarter 3"
    },
    {
      "value":"414500",
      "label":"Quarter 4"
    }
  ]
}
The above data produces a chart with the £ symbol prefixed to all numeric values:

When using the HTML embedding method with data provided as embedded string, it is essential to encode pound character as %A3.
To display Yen character on a chart, you can simply include it in the XML/JSON data source of the chart. This is applicable in both Data Url and Data String methods.
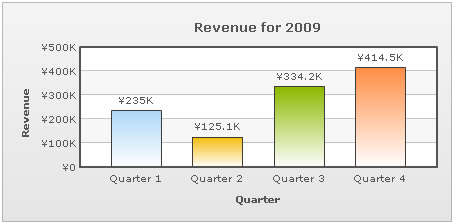
Following data includes ¥ character:
<chart showValues="1" caption="Revenue for 2009" numberPrefix="¥" xAxisName="Quarter" yAxisName="Revenue" >
    <set value="235000" label="Quarter 1"/>
    <set value="125100" label="Quarter 2"/>
    <set value="334200" label="Quarter 3"/>
    <set value="414500" label="Quarter 4"/>
</chart>
{
  "chart":{
    "showvalues":"1",
    "caption":"Revenue for 2009",
    "numberprefix":"¥",
    "xaxisname":"Quarter",
    "yaxisname":"Revenue"
  },
  "data":[{
      "value":"235000",
      "label":"Quarter 1"
    },
    {
      "value":"125100",
      "label":"Quarter 2"
    },
    {
      "value":"334200",
      "label":"Quarter 3"
    },
    {
      "value":"414500",
      "label":"Quarter 4"
    }
  ]
}
The above data produces a chart with ¥ prefixed to all numeric values:
When using the HTML embedding method with data provided as embedded string, it is essential to encode yen character as %A5.
To display Cent character on a chart, you can simply include it in the XML/JSON data source of the chart. This is applicable in both Data Url and Data String methods.
Following data includes ¢ character:
<chart showValues="1" caption="Revenue for 2009" numberPrefix="¢" xAxisName="Quarter" yAxisName="Revenue" >
    <set value="235000" label="Quarter 1"/>
    <set value="125100" label="Quarter 2"/>
    <set value="334200" label="Quarter 3"/>
    <set value="414500" label="Quarter 4"/>
</chart>
{
  "chart":{
    "showvalues":"1",
    "caption":"Revenue for 2009",
    "numberprefix":"¢",
    "xaxisname":"Quarter",
    "yaxisname":"Revenue"
  },
  "data":[{
      "value":"235000",
      "label":"Quarter 1"
    },
    {
      "value":"125100",
      "label":"Quarter 2"
    },
    {
      "value":"334200",
      "label":"Quarter 3"
    },
    {
      "value":"414500",
      "label":"Quarter 4"
    }
  ]
}
The above data produces a chart with ¢ prefixed to all numeric values:

When using the HTML embedding method with data provided as embedded string, it is essential to encode cent character as %A2.
To display Euro character on a chart, you can simply include it in the XML/JSON data source of the chart. This is applicable in both Data Url and Data String methods.
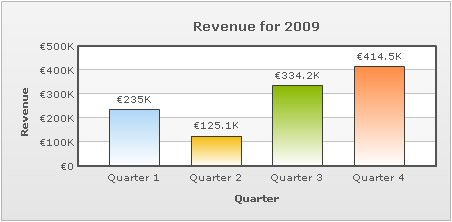
Following data includes € character:
<chart showValues="1" caption="Revenue for 2009" numberPrefix="€" xAxisName="Quarter" yAxisName="Revenue" >
    <set value="235000" label="Quarter 1"/>
    <set value="125100" label="Quarter 2"/>
    <set value="334200" label="Quarter 3"/>
    <set value="414500" label="Quarter 4"/>
</chart>
{
  "chart":{
    "showvalues":"1",
    "caption":"Revenue for 2009",
    "numberprefix":"€",
    "xaxisname":"Quarter",
    "yaxisname":"Revenue"
  },
  "data":[{
      "value":"235000",
      "label":"Quarter 1"
    },
    {
      "value":"125100",
      "label":"Quarter 2"
    },
    {
      "value":"334200",
      "label":"Quarter 3"
    },
    {
      "value":"414500",
      "label":"Quarter 4"
    }
  ]
}
The above data produces a chart with the € symbol prefixed to all numeric values:
Euro character falls into the category of extended unicode character-set. To display a euro character in your chart, the XML file should be encoded with UTF-8 BOM signature, otherwise the character will not be displayed properly. To know more about BOM and how to add it in your XML, please read What is BOM.
When using the HTML embedding method with data provided as embedded string, you need to use %E2%82%AC (the encoded form) instead of € character.
To display Franc character on a chart, you can simply include it in the XML/JSON data source of the chart. This is applicable in both Data Url and Data String methods.
Following data includes ₣ character:
<chart showValues="1" caption="Revenue for 2009" numberPrefix="₣" xAxisName="Quarter" yAxisName="Revenue" >
    <set value="235000" label="Quarter 1"/>
    <set value="125100" label="Quarter 2"/>
    <set value="334200" label="Quarter 3"/>
    <set value="414500" label="Quarter 4"/>
</chart>
{
  "chart":{
    "showvalues":"1",
    "caption":"Revenue for 2009",
    "numberprefix":"₣",
    "xaxisname":"Quarter",
    "yaxisname":"Revenue"
  },
  "data":[{
      "value":"235000",
      "label":"Quarter 1"
    },
    {
      "value":"125100",
      "label":"Quarter 2"
    },
    {
      "value":"334200",
      "label":"Quarter 3"
    },
    {
      "value":"414500",
      "label":"Quarter 4"
    }
  ]
}
The above data produces a chart with ₣ prefixed to all numeric values:

Franc character falls into the category of extended unicode character-set. To display a franc character in your chart, the XML file should be encoded with UTF-8 BOM signature, otherwise the character will not be displayed properly. To know more about BOM and how to add it in your XML, please refer to What is BOM.
When using the HTML embedding method with data provided as embedded string, you need to use %E2%82%A3 (the encoded form) instead of ₣ character.