In this section, we'll show you how to use FusionCharts with PHP to plot data collected in forms.
We'll build a simple restaurant sales example, where the user will enter the items sold by a restaurant in a given week. This data will be submitted in a form to the server. We'll acquire this data and plot in on a chart. For the sake of simplicity, we wouldn't do any processing on this data. However, your real life applications might process data before presenting it on the chart.
Before you go further with this page, we recommend you to please see the previous section "Basic Examples" as we start off from concepts explained in that page.
The form is contained in Default.php and looks as under:
It's a very simple form which submits to Chart.php. As such, we wouldn't go into the code of this form. You can directly open the source from download and see it.
The work of requesting the data from submitted form and creating the chart is done in Chart.php, present in the same folder. It contains the following code:
<?php
      //We've included ../Includes/FusionCharts.php, which contains functions
      //to help us easily embed the charts.
      include("../Includes/FusionCharts.php");
      ?>
      <HTML>
         <HEAD>
        <TITLE>FusionCharts - Form Based Data Charting Example</TITLE>
        <SCRIPT LANGUAGE="Javascript" SRC="../../FusionCharts/FusionCharts.js"></SCRIPT>
     </HEAD>
     <BODY>
  <?php
         //We first request the data from the form (Default.php)
         $intSoups = $_POST['Soups'];
         $intSalads = $_POST['Salads'];
         $intSandwiches = $_POST['Sandwiches'];
         $intBeverages = $_POST['Beverages'];
         $intDesserts = $_POST['Desserts'];
         //Now that we've the data in variables, we need to convert this into XML.
         //The simplest method to convert data into XML is using string concatenation.
         //Initialize <chart> element
         $strXML  = "<chart caption='Sales by Product Category' subCaption='For this week' showPercentValues='1' pieSliceDepth='30' showBorder='1'>";
         //Add all data
         $strXML .= "<set label='Soups' value='" . $intSoups . "' />";
         $strXML .= "<set label='Salads' value='" . $intSalads . "' />";
         $strXML .= "<set label='Sandwiches' value='" . $intSandwiches . "' />";
         $strXML .= "<set label='Beverages' value='" . $intBeverages . "' />";
         $strXML .= "<set label='Desserts' value='" . $intDesserts . "' />";
         //Close <chart> element
         $strXML .= "</chart>";
         'Create the chart - Pie 3D Chart with data from $strXML
         echo renderChart("../../FusionCharts/Pie3D.swf", "", $strXML, "Sales", 500, 300, false, true);
      ?>
      </BODY>
    </HTML>
As you can see in the above code, we're doing the following:
- Including FusionCharts.js and FusionCharts.php in this page.
- Requesting data from the submitted form and storing it in local variables
- Creating an XML data document using string concatenation and storing it in strXML variable
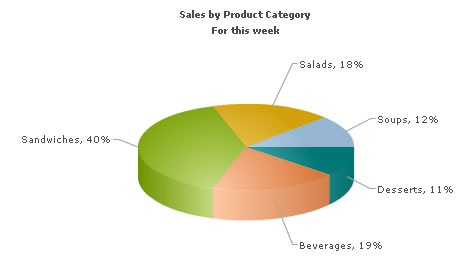
- Creating a Pie 3D chart using renderChart() function and passing strXML as dataStr for the chart.
When you finally run the code, you'll see a chart as under: