In this section, we'll show you how to use FusionCharts and PHP to plot charts from data contained in PHP arrays. We'll cover the following examples here:
- Creating a single series chart from data contained in arrays
- Creating a multi-series chart from data contained in arrays
Before you go further with this page, we recommend you to please see the previous section "Basic Examples" as we start off from concepts explained in that page.
The code examples contained in this page are present in Download Package > Code > PHP > ArrayExample folder.
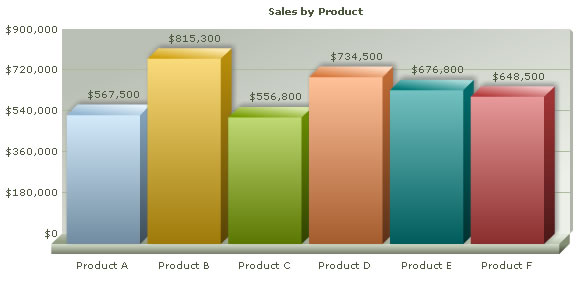
The code to create a single series chart is contained in SingleSeries.php and can be listed as under:
 <?php
      //We've included ../Includes/FusionCharts.php, which contains functions
      //to help us easily embed the charts.
      include("../Includes/FusionCharts.php");
      ?>
      <HTML>
         <HEAD>
        <TITLE>	FusionCharts - Array Example using Single Series Column 3D Chart</TITLE>
        <SCRIPT LANGUAGE="Javascript" SRC="../../FusionCharts/FusionCharts.js"></SCRIPT>
     </HEAD>
     <BODY>
     <?php
         //In this example, we plot a single series chart from data contained
   //in an array. The array will have two columns - first one for data label
   //and the next one for data values.
   //Let's store the sales data for 6 products in our array). We also store
   //the name of products.
         //Store Name of Products
         $arrData[0][1] = "Product A";
         $arrData[1][1] = "Product B";
         $arrData[2][1] = "Product C";
         $arrData[3][1] = "Product D";
         $arrData[4][1] = "Product E";
         $arrData[5][1] = "Product F";
         //Store sales data
         $arrData[0][2] = 567500;
         $arrData[1][2] = 815300;
         $arrData[2][2] = 556800;
         $arrData[3][2] = 734500;
         $arrData[4][2] = 676800;
         $arrData[5][2] = 648500;
         //Now, we need to convert this data into XML. We convert using string concatenation.
         //Initialize <chart> element
         $strXML = "<chart caption='Sales by Product' numberPrefix='$' formatNumberScale='0'>";
         //Convert data to XML and append
         foreach ($arrData as $arSubData)
         $strXML .= "<set label='" . $arSubData[1] . "' value='" . $arSubData[2] . "' />";
         'Close <chart> element
         $strXML .= "</chart>";
         //Create the chart - Column 3D Chart with data contained in strXML
         echo renderChart("../../FusionCharts/Column3D.swf", "", $strXML, "productSales", 600, 300, false, true);
        ?>
  </BODY>
</HTML>
In the above example, we first include FusionCharts.js file to enable us embed the chart using JavaScript. We also include FusionCharts.php to help us easily embed the charts.
Thereafter, we define a PHP array arrData to store sales data for 6 different products. The array has two columns - first one for data label and the next one for data values.
We define a variable strXML to store the entire XML data. To build the XML, we iterate through the array and using string concatenation. Finally, we render the chart using renderChart() function and pass strXML as dataStr.
When you view the chart, you'll see a chart as under:
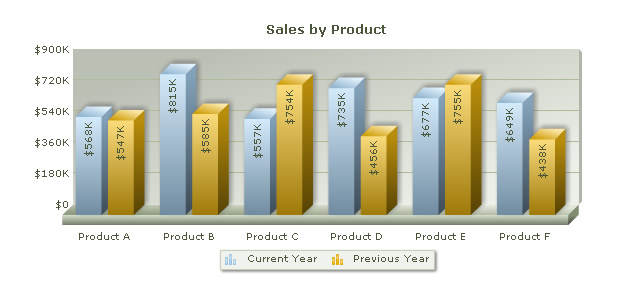
Let us now create a multi-series chart from data contained in arrays. We create a file MultiSeries.php with the following code:
<?php //We've included ../Includes/FusionCharts.php, which contains functions //to help us easily embed the charts. include("../Includes/FusionCharts.php"); ?> <HTML> <HEAD> <TITLE>FusionCharts - Array Example using Multi Series Column 3D Chart </TITLE> <SCRIPT LANGUAGE="Javascript" SRC="../../FusionCharts/FusionCharts.js"></SCRIPT> </HEAD> <BODY> <?php //In this example, we plot a multi series chart from data contained //in an array. The array will have three columns - first one for data label (product) //and the next two for data values. The first data value column would store sales information //for current year and the second one for previous year. //Let's store the sales data for 6 products in our array. We also store //the name of products. //Store Name of Products $arrData[0][1] = "Product A"; $arrData[1][1] = "Product B"; $arrData[2][1] = "Product C"; $arrData[3][1] = "Product D"; $arrData[4][1] = "Product E"; $arrData[5][1] = "Product F"; //Store sales data for current year $arrData[0][2] = 567500; $arrData[1][2] = 815300; $arrData[2][2] = 556800; $arrData[3][2] = 734500; $arrData[4][2] = 676800; $arrData[5][2] = 648500; 'Store sales data for previous year $arrData[0][3] = 547300; $arrData[1][3] = 584500; $arrData[2][3] = 754000; $arrData[3][3] = 456300; $arrData[4][3] = 754500; $arrData[5][3] = 437600;//Now, we need to convert this data into multi-series XML. //We convert using string concatenation. // $strXML - Stores the entire XML // $strCategories - Stores XML for the <categories> and child <category> elements // $strDataCurr - Stores XML for current year's sales // $strDataPrev - Stores XML for previous year's sales //Initialize <chart> element $strXML = "<chart caption='Sales by Product' numberPrefix='$' formatNumberScale='1' rotateValues='1' placeValuesInside='1' decimals='0' >"; //Initialize <categories> element - necessary to generate a multi-series chart $strCategories = "<categories>"; 'Initiate <dataset> elements $strDataCurr = "<dataset seriesName='Current Year'>"; $strDataPrev = "<dataset seriesName='Previous Year'>"; //Iterate through the data foreach ($arrData as $arSubData) { //Append <category label='...' /> to strCategories $strCategories .= "<category label='" . $arSubData[1] . "' />"; //Add <set value='...' /> to both the datasets $strDataCurr .= "<set value='" . $arSubData[2] . "' />"; $strDataPrev .= "<set value='" . $arSubData[3] . "' />"; } //Close <categories> element $strCategories .= "</categories>"; //Close <dataset> elements $strDataCurr .= "</dataset>"; $strDataPrev .= "</dataset>"; //Assemble the entire XML now $strXML .= $strCategories . $strDataCurr . $strDataPrev . "</chart>"; //Create the chart - MS Column 3D Chart with data contained in strXML echo renderChart("../../FusionCharts/MSColumn3D.swf", "", $strXML, "productSales", 600, 300, false, true); ?> </HTML>
In the above example, we first include FusionCharts.js file to enable us embed the chart using JavaScript. We also include FusionCharts.php to help us easily embed the charts.
Thereafter, we define a PHP array arrData to store sales data for 6 different products. The array has three columns - first one for data label (product) and the next two for data values. The first data value column would store sales information
for current year and the second one for previous year.
We define a variable strXML to store the entire XML data. We also define strCategories, strDataCurr and strDataPrev variables to store XML data for categories elements, current year's dataset and previous year's dataset respectively. To build the XML, we iterate through the array and using string concatenation. We concatenate the entire XML finally in strXML.
Finally, we render the chart using renderChart() function and pass strXML as dataStr.
When you view the chart, you'll see a chart as under:
In Download Package > Code > PHP > ArrayExample, we've more example codes to create Stacked and Combination Charts too, which have not been explained here, as they're similar in concept. You can directly see the code if you want to.