In this section, we'll show you how to use FusionCharts PHP class functions to plot data collected in forms.
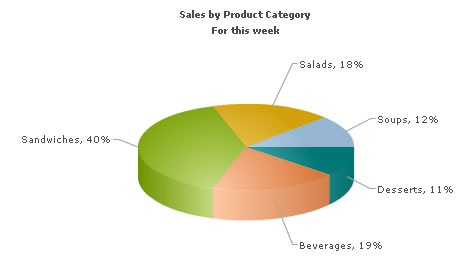
We'll build a simple restaurant sales example, where the user will enter the items sold by a restaurant in a given week. This data will be submitted in a form to the server. We'll acquire this data and plot it on a chart. For the sake of simplicity, we wouldn't do any processing on this data. However, your real life applications might require data validation or processing before presenting it on the chart.
Before you go further with this page, we recommend you to please see the previous section "Basic Examples" as we start off from concepts explained in that page.
<?php
//We've included ../Includes/FusionCharts_Gen.php, which contains FusionCharts PHP Class
//to help us easily embed the charts.
include("../Includes/FusionCharts_Gen.php");
?>
<HTML>
<HEAD>
<TITLE>
FusionCharts v3 - Form Based Data Charting Example
</TITLE>
<?php
//You need to include the following JS file, if you intend to embed the chart using JavaScript.
//Embedding using JavaScripts avoids the "Click to Activate..." issue in Internet Explorer
//When you make your own charts, make sure that the path to this JS file is correct.
//Else, you would get JavaScript errors.
?>
<SCRIPT LANGUAGE="Javascript" SRC="../../FusionCharts/FusionCharts.js"></SCRIPT>
</HEAD>
<BODY>
<CENTER>
<h4>Restaurant Sales Chart below</h4>
<?php
//We first request the data from the form (Default.php)
$intSoups = $_REQUEST['Soups'];
$intSalads = $_REQUEST['Salads'];
$intSandwiches = $_REQUEST['Sandwiches'];
$intBeverages = $_REQUEST['Beverages'];
$intDesserts = $_REQUEST['Desserts'];
//In this example, we're directly showing this data back on chart.
//In your apps, you can do the required processing and then show the
//relevant data only.
//Now that we've the data in variables, we need to convert this into chart data using
//FusionCharts PHP Class
# Create Pie 3D chart object
$FC = new FusionCharts("Pie3D","600","300");
# Set Relative Path of chart SWF file
$FC->setSwfPath("../../FusionCharts/");
//Store Chart attributes in a variable
$strParam="caption=Sales by Product Category;subCaption=For this week;showPercentValues=1; showPercentageInLabel=1;pieSliceDepth=25;showBorder=1;decimals=0";
# Set chart attributes
$FC->setChartParams($strParam);
//Add all data
$FC->addChartData($intSalads,"label=Salads");
$FC->addChartData($intSandwiches,"label=Sandwiches");
$FC->addChartData($intBeverages,"label=Beverages");
$FC->addChartData($intDesserts,"label=Desserts");
//Create the chart
$FC->renderChart();
?>
<a href='Default.php'>Enter data again</a>
</CENTER>
</BODY>
</HTML>
- Including FusionCharts_Gen.php and FusionCharts.js in this page.
- Requesting data from the form in Default.php and storing the values in local variables.
- Creating an instance of FusionCharts PHP class for a Pie 3D chart with 600 pixels width, 300 pixels height.
- Setting relative path of chart SWF file using setSWFPath() function.
- Storing chart attributes in $strParam variable.
- Setting chart attributes using setChartParams() function.
- Adding chart data with addChartData() function.
- Finally, rendering the chart using renderChart() function.