FusionCharts PHP Class API lets you configure the attributes of various chart elements like dataset, dataplot, categories etc. In this section we will see sample usage of those functions of FusionCharts PHP Class which help you to do the same. Topics include:
Attributes which are specific to <categories> element can be set using setCategoriesParams function. We will pass a delimiter (default is ;) separated list of attributes to the function.
$FC->setCategoriesParams("font=Arial;fontSize=13;fontColor=ff0000");We can configure each category while adding a category using addCategory function. This is done by passing category attributes as a list of delimiter separated attributes as the second parameter to the addCategory function.
$FC->addCategory("Week 1","toolText=Sales for week 1");
$FC->addCategory("Week 2 ","toolText=Sales for second week;showlabel=1");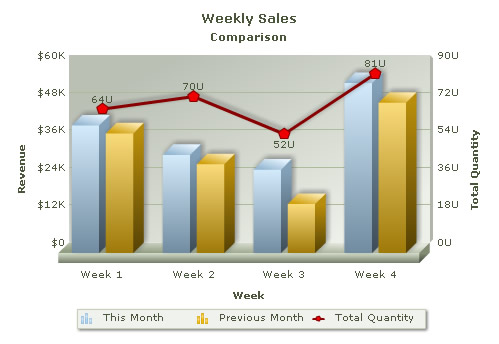
$FC->addCategory("Week 3 ","showlabel=0");To provide dataset attributes we need to use the function - addDataset. It accepts the seriesName attribute of the dataset as its first parameter. The other parameter accepts a delimiter (default is ;) separated list of dataset attributes.
$FC->addDataset("This Month","showValues=0;parentYAxis=P");
...
$FC->addDataset("Previous Month","showValues=0;parentYAxis=P");
...
$FC->addDataset("Total Quantity","parentYaxis=S;anchorSides=5;anchorradius=6;color=880000;anchorBgcolor=EE0000");
The chart that follows is as shown below:
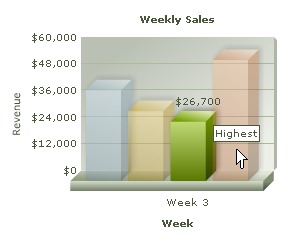
setChartParams() function sets chart parameters globally. However, we may need to set specific properties to particular dataplot. To do so, we need to send the parameters through addChartData() function while feeding data. Consider the code below:
# Create a line chart object
   $FC = new FusionCharts("Column3D","300","250");
        ...
        # add chart values and category names
        $FC->addChartData("48200", "label=Week 1;alpha=40;showlabel=0;showValue=0");
        $FC->addChartData("32100", "label=Week 2;alpha=40;showlabel=0;showValue=0");
        $FC->addChartData("21400", "label=Week 3;hoverText=Lowest;link=tooLow.php");
        $FC->addChartData("54400", "label=Week 4;showlabel=0;showValue=0; alpha=40; hoverText=Highest");
        ...