FusionCharts v3 introduces gradient fill for various chart elements like background, canvas, plot etc. You can now fill these chart objects using gradient patterns, whose properties can be decided and set by you.
We'll use the example of background and see how to apply gradients to background, as the background is common to all charts. The background of each chart can be configured using the following 4 attributes:
| bgColor | This attribute sets the background color for the chart. To specify a gradient as background color, separate the hex color codes of each color in the gradient using comma. Example: FF5904,FFFFFF. Remember to remove # and any spaces in between. |
| bgAlpha | Sets the alpha (transparency) for the background. If you've opted for gradient background, you need to set a list of alpha(s) separated by comma. |
| bgRatio | If you've opted for a gradient background, this attribute lets you set the ratio of each color constituent. |
| bgAngle | Angle of the background color, in case of a gradient. |
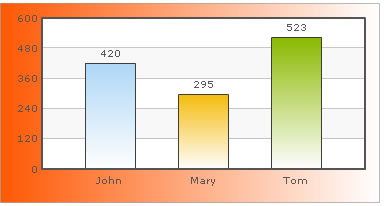
Let's now see how to apply a simple custom gradient to the background. We'll create a gradient that starts from orange (#ff5904) and fades into white (#ffffff) and will be evenly distributed on the background. For a start, we'll set the alpha as 100 for both the color constituents and set angle as 0 degree (left to right). The following data helps us do so:
<chart bgColor='FF5904,FFFFFF' bgAlpha='100,100' bgRatio='0,100' bgAngle='0'>
   <set label='John' value='420' />
   <set label='Mary' value='295' />
   <set label='Tom' value='523' />
</chart>
{
  "chart":{
    "bgcolor":"FF5904,FFFFFF",
    "bgalpha":"100,100",
    "bgratio":"0,100",
    "bgangle":"0"
  },
  "data":[{
      "label":"John",
      "value":"420"
    },
    {
      "label":"Mary",
      "value":"295"
    },
    {
      "label":"Tom",
      "value":"523"
    }
  ]
}
Here, we're first defining bgColor as a comma separated list of colors (hex codes without #) which we want our gradient to contain.
Now for each color, we've to specify an alpha in bgAlpha attribute, again as comma separated values. When this attribute is defined as bgAlpha="80,50" and is coupled with bgColor="FF5904,FFFFFF", the color FF5904 would be shown in 80% alpha while the color FFFFFF would be shown in 50% alpha.
Please note that when you use this attribute, you need to make sure that number of colors defined in bgColor is same as the number of alpha defined in bgAlpha. For example, if you are creating a gradient fill by specifying 2 colors, then you need to specify 2 alphas for this attribute as well, or else you may get unexpected results.
Next, we've defined our ratio for the gradient fill as bgRatio='0,100'. When this attribute is defined as bgRatio="80,20" and is coupled with bgColor="FF5904,FFFFFF", the color FF5904 would occupy 80% of the gradient fill while the color FFFFFF would get 20%. As in bgAlpha, there needs to be as many ratio values separated by commas as there are colors in bgColor. Also, the sum of all the ratio values should be 100. By default, FusionCharts splits all the colors in the list proportionally i.e., if you have 2 colors and don't define this attribute, then both the colors would have 50% fill ratio.
Finally, we set the angle of the gradient as 0 degree (left to right).
When you now see the chart, you'll get the following output:
In this example, we only saw how to apply gradient to background. In 2D charts, you can apply gradients to chart canvas also.
Moreover, in Column 2D and Area 2D charts, you can use plotGradientColor attribute to specify gradients for data plot too.