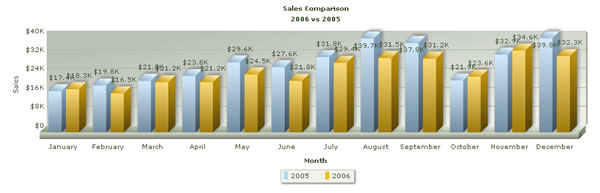
In our previous examples, we were using single series XML Data, as we were plotting data for just 1 year. Let's now consider a case where we want to compare our sales data for 2006 against sales data for 2005.
Our data table would look as under:
| Month | 2005 |
2006 |
| January | $17400 |
$18300 |
| February | $19800 |
$16500 |
| March | $21800 |
$21200 |
| April | $23800 |
$21200 |
| May | $29600 |
$24500 |
| June | $27600 |
$21800 |
| July | $31800 |
$29400 |
| August | $39700 |
$31500 |
| September | $37800 |
$31200 |
| October | $21900 |
$23600 |
| November | $32900 |
$34600 |
| December | $39800 |
$32300 |
To build the XML data document for this data, again launch our XML Generator Utility and choose option 1 "I want to manually enter data".
Now, first enter the data series name in the grid (2005, 2006 etc.) by clicking on column header and changing it from Series_1 (or Series_2 ...) to our required value (2005, 2006). Thereafter enter the actual values as shown below:
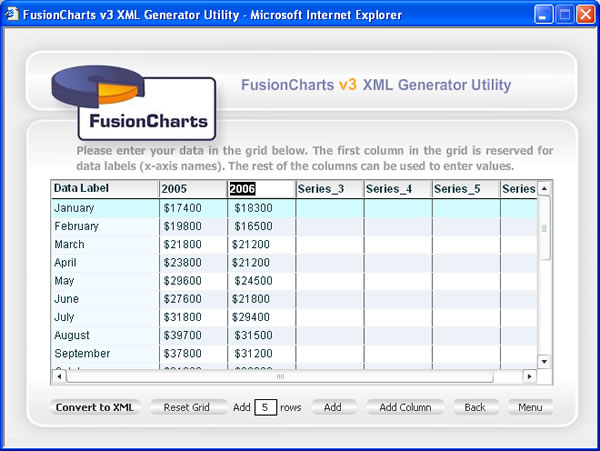
When you now click on "Convert to XML" button, you'll see that the utility has converted this data into multi-series XML data format as shown below:
Again, configure the chart properties and save this data along with HTML, as explained before.
When you now see the chart, you'll get the following results: