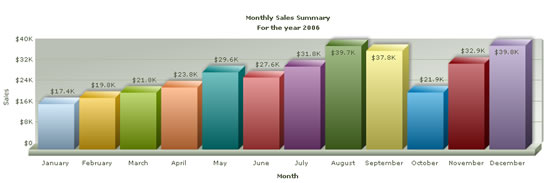
Here, we'll get our hands down n dirty and create our first chart using the FusionCharts XML Generator Tool. As our first example, we'll create a simple Monthly Sales Chart.
When we'll be finished, our chart would look as under:
To create any FusionCharts chart, you need to assemble the following four things:
- SWF File for the chart that you want to create. We want to create a 3D Column Chart, whose SWF file is named as Column3D.swf. All the chart SWF files are present in Download Package > Charts folder.
- FusionCharts JavaScript Files - These file (FusionCharts.js, highcharts.js & jquery.min.js) are present in Download Package > Charts folder.
- XML Data File. As you already know by now, FusionCharts accepts data only in a pre-defined XML format. We'll build the XML data using our visual tool soon.
- HTML Wrapper File. This HTML file would contain the code to embed the chart. Again, we'll build this using the visual tool.
We now need to set the playground for our first chart. Create a new folder named as MyFirstChart under any folder on your computer (say c:\FusionCharts, if you can't think of a better place). For each chart that you create using the FusionCharts visual GUI, you'll need to create a separate folder.
You can also have multiple charts in same folder. But, for that you'll need to do some code editing which is discussed in "Guide for Web Developers" section. Here, we've tried to keep things as simple as possible.
Next, you need to copy the chart SWF file from Download Package > Charts and the JavaScript files (FusionCharts.js, highcharts.js & jquery.min.js) from Download Package > Charts folder respectively into this folder. The setup should look as under till now:
That completes our setup for the chart creation. In this folder, we can now have 1 chart. For each chart that you create, you'll need to create a separate folder.
With the playground ready, it’s now just a two-step affair to pop-up enticing charts:
- Generate XML
- Create HTML Wrapper
Let's now shift our attention to creating the XML data file for this chart. XML generation is again split into following:
- Actual Data for plotting the Chart
- Chart Cosmetics like Caption, sub-caption, Titles for X and Y-axis and so on.
To build any chart, we first need to have the data that we'll represent on the chart. Since we're plotting monthly sales summary for a given year, our data in tabular form would look something like below. Each month given below would be represented on the chart as a 3D column.
| Month | Net Revenue |
| January | $17400 |
| February | $19800 |
| March | $21800 |
| April | $23800 |
| May | $29600 |
| June | $27600 |
| July | $31800 |
| August | $39700 |
| September | $37800 |
| October | $21900 |
| November | $32900 |
| December | $39800 |
Let's now convert it into XML. To do so, launch the XML Generator Utility by running XMLGenerator.html (present in Download Package > Tools) and click the "Launch XML Generator" button. You'll be presented with an interface showing three options as under:
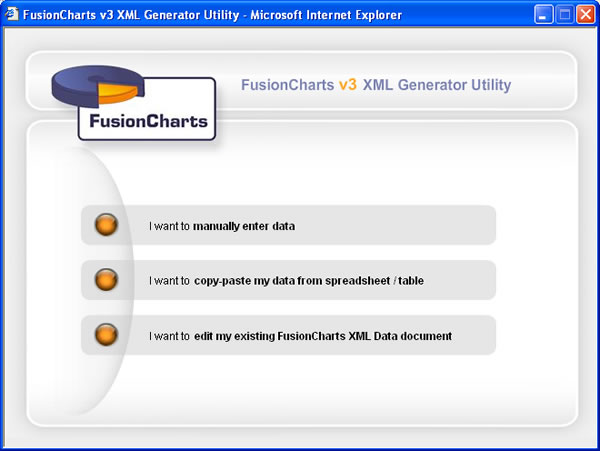
Now, since this is our first example, we'll take the simplest route of all - we'll manually enter our data in the tabular grid provided by this utility. So, click on "I want to manually enter data" button. You'll be provided with an empty grid as under:
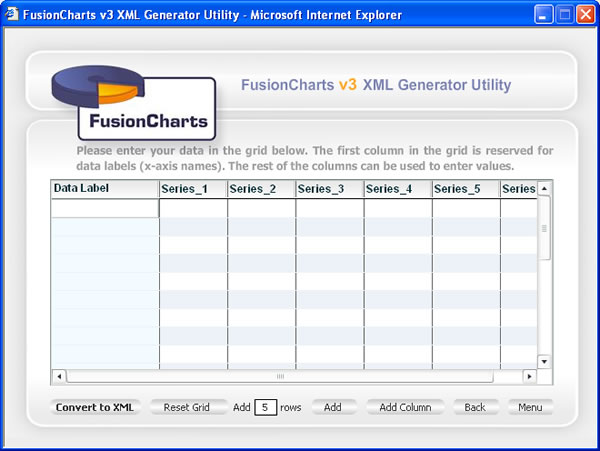
This is the screen where you can manually enter data. The first row in the grid is reserved for data labels - in our example, month names serve as data labels. The data labels appear on the x-axis of the chart. In the rest of columns, you can put in values for the respective data.
In our example, we're plotting data for just 1 year, so we would use only 1 column to enter data. Enter the data as under:
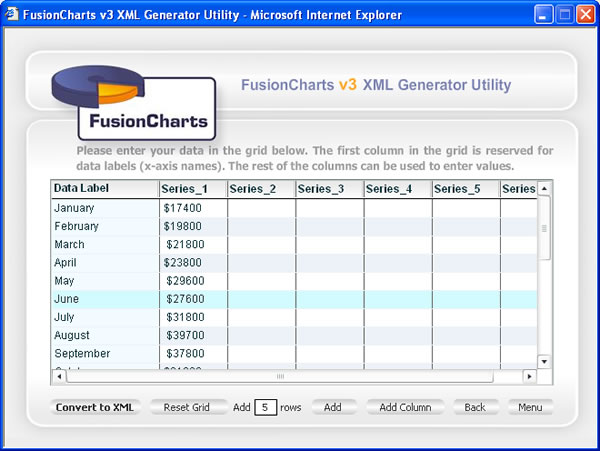
If the original number of rows are not sufficient to fit in your data, you can also add more rows to the grid by clicking on "Add" button next to "Add 5 rows". Now, to convert this data into XML, just click the "Convert to XML" button.
You'll now get a screen with the XML data representation as under:
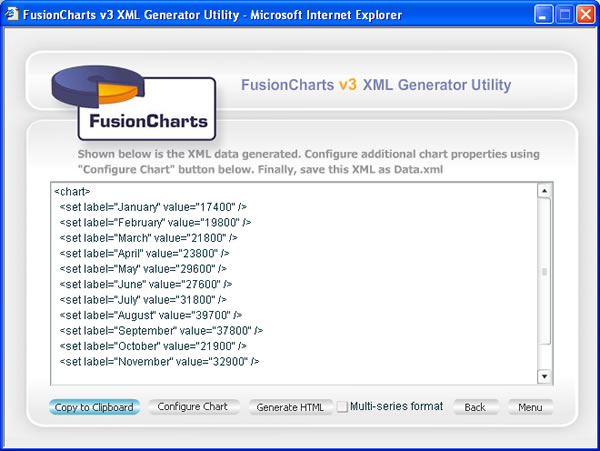
So, on the click of a button, our utility has cooked & converted your tabular data into XML format, as required by FusionCharts.
Let's now add some captions and axis names to our chart. To do so, click on "Configure Chart" button. You'll be provided with an interface to enter titles and additional parameters as under:
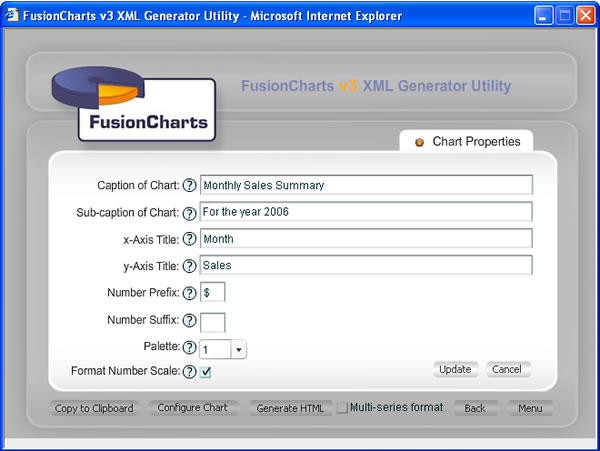
As you can see above, you can provide the caption, sub-caption, x-axis name and y-axis name for the chart. You can also enter a number prefix for the chart. Number prefix refers to a character which gets added to all the numbers on the chart. Since in our case, we're displaying sales figures in $, we set $ as number prefix. Similar to number prefix, number suffix characters gets added at the end of all the numbers on the chart.
Next, FusionCharts allows you to choose a palette (color theme) from 5 pre-defined palettes. Lastly, you can choose whether to format your numbers by scaling them into K (Thousands), M (Millions). If set to yes, 13000 would appear as 13K on chart, 12340000 would appear as 1.234M and so on.
FusionCharts v3 offers a lot more configurable properties, which can be configured via XML only. Those properties cannot be configured using this GUI.
Enter the above parameters and click the "Update" button. You'll now see that the XML has been updated with this information:
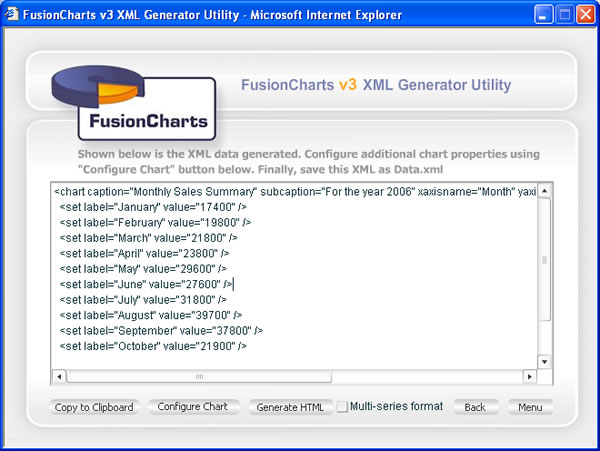
You now need to save this XML data for use by the chart. To do so, click on "Copy to Clipboard" button. This copies the XML data to your clipboard. Next, paste it in a text editor and save it as Data.xml in our previous MyFirstChart folder.
Now, the final step left is to create the HTML code for the chart, which we'll see next.
To create the HTML code for this chart, click the "Generate HTML" button in the above screen. You'll be presented with the following screen where you can select your chart type, width and height (in pixels). Select Column 3D as chart type and enter your desired width and height as under:
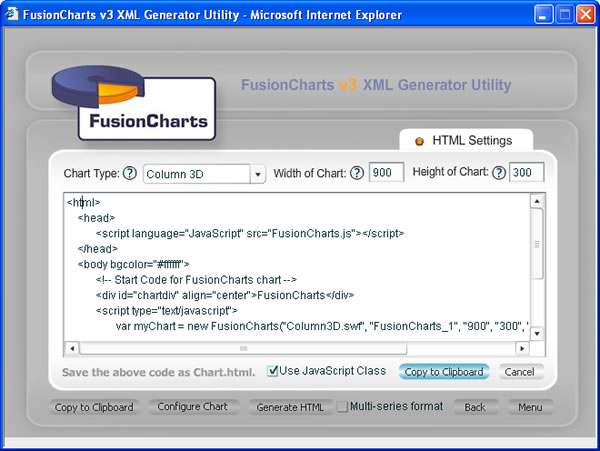
You'll see that when you change the chart type or dimensions, the HTML code in the text-area below gets dynamically updated. You now need to save this HTML code. Again use the "Copy to Clipboard" button and save this HTML as Chart.html in the same folder.
And that marks the end of chart creation process. To view the chart, explore to our MyFirstChart folder and run Chart.html in your browser. You'll get an animated Column 3D chart as shown below.
A painless and rewarding experience indeed! We just proved how easily you can now build animated and interactive charts for your websites or presentations using this new GUI tool.
We'll next see how to convert this Column 3D chart into Pie 3D Chart.