Using the Visual XML Generator tool, you can also plot charts from your data stored as delimiter separated data e.g., CSV (Comma Separated Values) or Tab separated Values.
Delimited data uses specific characters (delimiters) to separate its values. Any character may be used to separate the values, but the most common characters used are the comma, tab and space. For example, in a comma-separated values (CSV) file the data items are delimited using commas. Delimited data is divided into columns and rows. Each line is a row of data. The lines are separated by carriage return character.
For example, the following data is delimited by comma character and newline characters:
Jan,$17400
Feb,$19800
Mar,$21800
Apr,$23800
May,$29600
Jun,$27600
Jul,$31800
Aug,$39700
Sep,$37800
Oct,$21900
Nov,$32900
Dec,$39800
In the above data, there are two columns of data - month and sales figure. Each row represents a month and is separated by carriage return character.
The delimiter here is comma, as that separates two data items on the same row. A delimiter is a sequence of one or more characters used to specify the boundary between data columns in a given row.
More examples of delimited data:
Jan;$17400
Feb;$19800
Mar;$21800
Apr;$23800
May;$29600
Jun;$27600
Jul;$31800
Aug;$39700
Sep;$37800
Oct;$21900
Nov;$32900
Dec;$39800
Example of semi-colon separated data
Jan $17400
Feb $19800
Mar $21800
Apr $23800
May $29600
Jun $27600
Jul $31800
Aug $39700
Sep $37800
Oct $21900
Nov $32900
Dec $39800
Example of space separated data
You can also have multiple columns of data in the same row. For example, in the data below, we've 7 columns of data in each row separated by comma.
10/28/2006,23.300,23.540,22.900,23.080,16,383,998
10/27/2006,23.300,23.540,22.900,23.110,17,027,760
10/26/2006,23.100,23.500,22.890,23.370,14,095,750
10/25/2006,23.265,23.310,22.800,23.070,19,890,630
10/24/2006,23.420,23.560,23.180,23.280,15,415,720
10/23/2006,23.430,23.930,23.370,23.600,12,736,720
10/20/2006,23.360,23.650,22.970,23.540,20,828,490
10/19/2006,23.700,23.701,23.050,23.120,39,415,240
10/18/2006,24.680,24.950,24.180,24.700,18,208,730
10/17/2006,24.330,24.720,24.220,24.540,21,782,780
10/16/2006,24.090,24.730,24.000,24.620,20,307,960
10/13/2006,23.880,24.331,23.710,23.950,16,910,650
If your data contains the delimiter as a part of data, you'll need to use qualifiers to escape that character sequence. For example, if your data is :
Doe, Mary $550 45
and you want to separate it using commas, you'll have to use double quotes as qualifier as under in FusionCharts XML GUI:
"Doe,Mary","$550","45"
Note that all the data fields would have to use the qualifier now - and not just the field that contains the delimiter.
Let's now see how to build charts from delimiter separated data. Before that, we reiterate that in FusionCharts XML GUI, you'll have to:
- Use the same delimiter throughout your data
- If you're using qualifiers for your data, the qualifier has to be applied to all columns and rows of data, irrespective of whether they contain escape characters or not.
We'll now convert the following comma separated data into a chart.
Jan,$17400
Feb,$19800
Mar,$21800
Apr,$23800
May,$29600
Jun,$27600
Jul,$31800
Aug,$39700
Sep,$37800
Oct,$21900
Nov,$32900
Dec,$39800
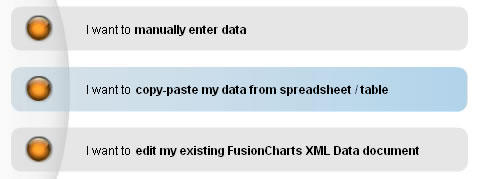
To do so, launch the XML Generator and select the second option "I want to copy-paste my data from spreadsheet / table..."
In the text area that you now get, paste the CSV data. Also, select Comma as the delimiter and leave qualifier as none, as we do not have a qualifier in this data.
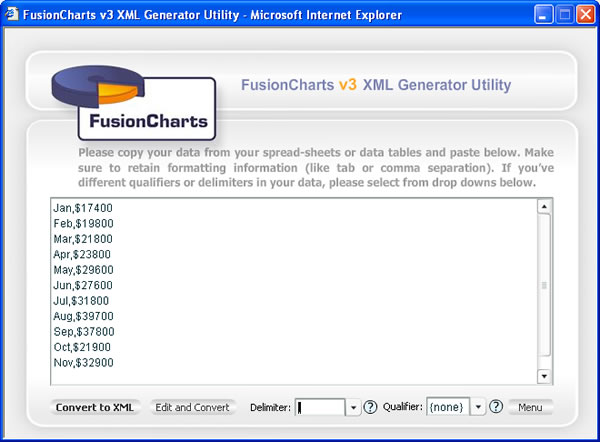
Now, you've two options to convert it into XML:
- You can directly convert this data into XML without making any changes to it.
- Or, you can edit this data in the grid and then convert it to XML.
To choose option 1, click on "Convert to XML" button. You'll instantly get the XML as under:
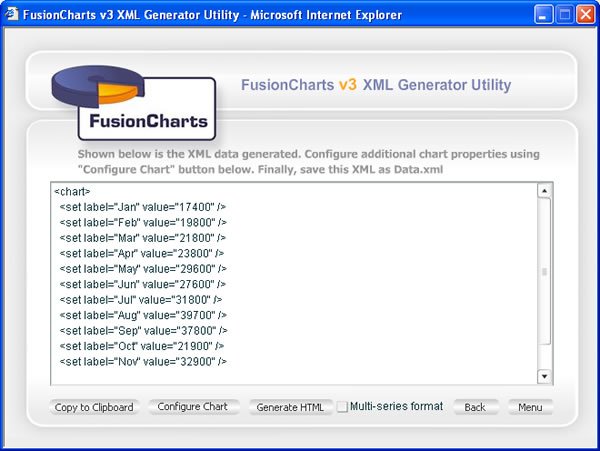
You can now configure the chart properties or generate HTML from here as explained in earlier sections.
Going back to previous step, if you had wished to edit the data before conversion, you can click on "Edit and Convert" button. This lets you edit your data in a grid as under:
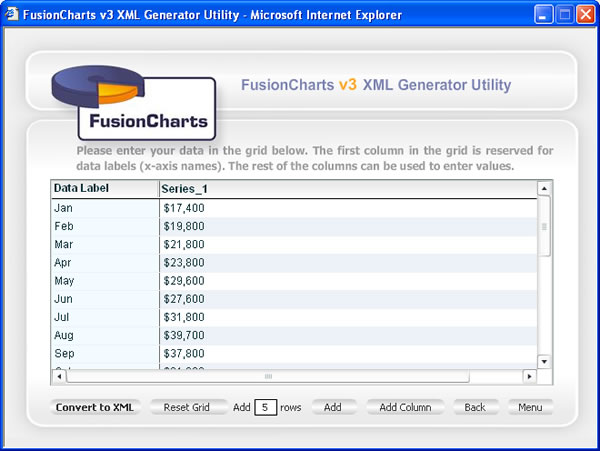
After editing your data, you can now click on "Convert to XML" button to generate the XML and finally chart.