In our previous example, we had seen how to load a single Column 2D chart in a Flash movie. Here, we'll see how to load two charts in a single Flash Movies.
Loading two (or more charts) in your Flash movie is as simple and straight-forward as loading a single movie. You just need to create instances of each chart class, provide it the right XML data and then ask it to render.
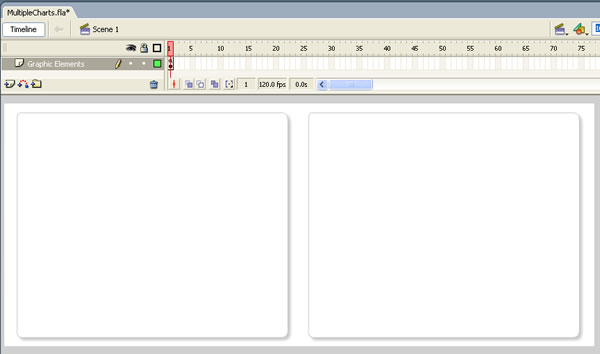
For this example, we create MultipleCharts.fla under FlashExamples folder. Like in previous example, we create a layer "Graphic Elements" in this file too and add two oval backgrounds instead of one, as we'll now be loading two charts. Shown below is a reference image:
Now, in the Actions Layer of this movie, punch the following code:
//You first need to include the following two files in your movie.
//These two files contain pre-loading functions and application
//messages for the chart.
//Note: If you're loading multiple charts in your Flash movie, you
//do NOT need to include these files for each each. You can put these
//lines in the main timeline, so that it gets loaded only once.
#include "com/fusioncharts/includes/LoadingFunctions.as"
#include "com/fusioncharts/includes/AppMessages.as"

//To create the chart, you now need to import the Class of the
//chart which you want to create. All charts are present in the package
//com.fusioncharts.core.charts (Download Package > SourceCode folder)
//If you're using multiple charts, you can import all the requisite
//chart classes in the main timeline of your movie. That ways, you
//wouldn't have to import the chart classes everytime you wish to use.
import com.fusioncharts.core.charts.Column2DChart;
import com.fusioncharts.core.charts.Line2DChart;

// ------------- XML Data for the charts -------------- //
//Data for chart 1
var strXML1:String = "<chart showBorder='0' bgAlpha='0,0' palette='1' caption='Hourly Working Rate' numberPrefix='$'>";
//Add simple data for demo.
strXML1 = strXML1+"<set label='John' value='32' />";
strXML1 = strXML1+"<set label='Mary' value='65' />";
strXML1 = strXML1+"<set label='Michelle' value='29' />";
strXML1 = strXML1+"<set label='Cary' value='43' />";
strXML1 = strXML1+"</chart>";
var xmlData1:XML = new XML(strXML1);

// Data for Chart 2
var strXML2:String = "<chart showBorder='0' bgAlpha='0,0' palette='1' caption='Hours Worked Last week' canvasPadding='20'>";
//Add simple data for demo.
strXML2 = strXML2+"<set label='John' value='49' />";
strXML2 = strXML2+"<set label='Mary' value='34' />";
strXML2 = strXML2+"<set label='Michelle' value='61' />";
strXML2 = strXML2+"<set label='Cary' value='40' />";
strXML2 = strXML2+"</chart>";
var xmlData2:XML = new XML(strXML2);
// --------------------------------------------------- //

// -------------- Actual Code to create the chart ------------//
//Create movie clips required for both the charts
var chartContainer1MC:MovieClip = this.createEmptyMovieClip("ChartHolder1", 1);
var chartContainer2MC:MovieClip = this.createEmptyMovieClip("ChartHolder2", 2);

//Now, instantiate the charts using Constructor function of the chart.
var chart1:Column2DChart = new Column2DChart(chartContainer1MC, 1, 380, 325, 20, 15, false, "EN", "noScale");
var chart2:Line2DChart = new Line2DChart(chartContainer2MC, 1, 380, 325, 440, 15, false, "EN", "noScale");

//Convey the XML data to chart.
chart1.setXMLData(xmlData1);
chart2.setXMLData(xmlData2);

//Draw the charts
chart1.render();
chart2.render();
//Stop
stop();
In the above code, we're:
- First including com/fusioncharts/includes/LoadingFunctions.as & com/fusioncharts/includes/AppMessages.as - required files for pre-loading chart.
- Thereafter, we import the Column2DChart class and Line2DChart Class as we'll be plotting two charts in this example.
- We now create the XML data for both the charts. In this example, again, we've hard-coded the XML data. You can create the XML data dynamically based on your data sources.
- We convert the XML data into XML Objects.
- We now create two empty movie clips - one for each chart.
- Next, we create instances of both the chart and pass the required parameters. We set the x and y offset of line so that it draws on the right of column chart.
- Moving on, we convey the XML data of each chart using setXMLData method.
- Finally, we draw both the charts by calling the render() method for each chart's instance object.
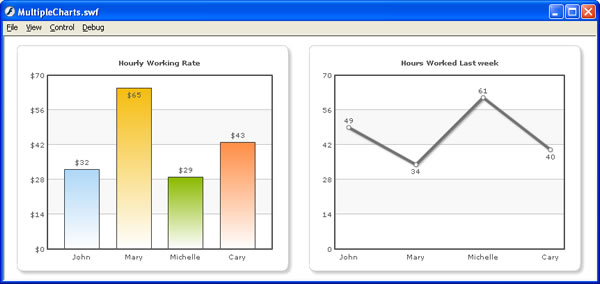
When you now view the application, you'll get the following output. Again, you might need to adjust the FPS of the movie based on your requirements.
In this example, we've included just the Column 2D and Line Charts. You can include any FusionCharts v3 chart in your application in the same way.
Also, here we've shown just 2 charts together. You can include any number of charts in your application (on a single screen too).
Now that you're fairly convinced of the power of FusionCharts in conjunction with Flash, let's move ahead and see an advanced example that will illustrate a few advanced features like updating chart data at run-time, hiding chart, re-initializing chart etc.