FusionCharts can also be rendered in Flash CS3/CS4 movies. To render charts in Flash CS3/CS4 you would need to use the pre-compiled chart SWF files from FusionCharts for Flex pack. Flash needs to loads these chart SWF files into the movie using help of loader class (named as FusionCharts) that we've built. The loader class is responsible for loading the charts, setting their properties like width, height, chart type, as well as passing data to the charts.
Please note that the loader class is present in Download Pack FusionCharts v3 (core) > Code > FlashExamples > CS3CS4 > com > fusioncharts > components folder
To create a chart in Flash CS3/CS4, first of all you need to download the FusionCharts for Flex pack, get the chart SWF files from the Charts folder of the FusionCharts for Flex Download Pack. Once downloaded, you need to do the following:
- Create a new Flash file using Flash CS3/CS4 and save it in location, say a folder called myCS3Chart
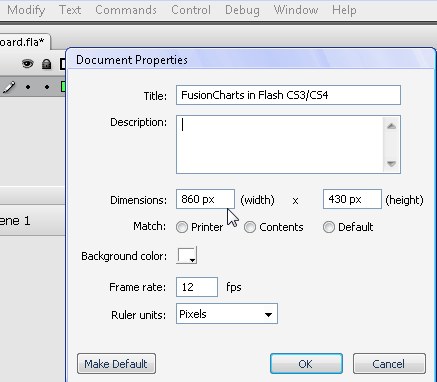
- Set width and height of the Flash Document properties to 860 to 430 (as shown in the image below)
- Save it in a location and create a new folder called fusioncharts in myCS3Chart folder
- Copy the chart SWF files from Flex pack to fusioncharts folder
- Copy com folder from Code > FlashExamples > CS3CS4 folder to myCS3Chart folder (this folder contains FusionCharts.as - the chart loader class)
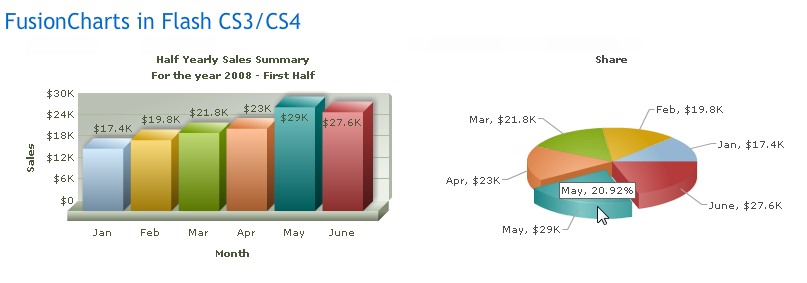
Once done, let's move to create a small sample showing half-yearly sales in two charts:
We will create two charts, a Column chart and a Pie chart showing sales data. The sales data (we named it SalesData.xml) in FusionCharts recognizable data-format looks like the following :
<chart caption='Half Yearly Sales Summary' subcaption='For the year 2008 - First Half' xAxisName='Month' yAxisName='Sales' numberPrefix='$'>
  <set label='Jan' value='17400' />
  <set label='Feb' value='19800' />
  <set label='Mar' value='21800' />
  <set label='Apr' value='23000' />
  <set label='May' value='29000' />
  <set label='June' value='27600' />
</chart>
We keep the XML file in myCS3Chart folder. To make the pie chart look different we change the caption to "share" and save the file as a new XML file named - PieData.xml in the same folder.
Thereafter, we will add the following code to the newly created Flash file's Layer 1:Frame 1 action:
//Import the FusionCharts Loader class
import com.fusioncharts.components.FusionCharts;
/*
 * In this sample we will create two charts showing
 * half yearly sales data. The first chart is a Column
 * chart showing sales figures in column. The same sales figures
 * are showing in a pie chart to visualize the share of revenue
*/
//Instantiate FusionCharts class
var ColumnSalesSummary:FusionCharts = new FusionCharts();
//Set relative path of chart SWF folder
ColumnSalesSummary.FCFolder = "fusioncharts";
//Set chart type to Column3D
ColumnSalesSummary.FCChartType = "Column3D";
//Set URL of data. You can also specify XML string here for the property FCDataXML, instead.
ColumnSalesSummary.FCDataURL = "SalesData.xml";
//Set chart position, width and height
ColumnSalesSummary.x = 25;
ColumnSalesSummary.y = 50;
ColumnSalesSummary.FCChartWidth = 400;
ColumnSalesSummary.FCChartHeight = 240;
//Call to render the chart
ColumnSalesSummary.FCRender();
//Add chart to display hierarchy
this.addChild(ColumnSalesSummary);
//Create the pie chart now. Same process.
//Instantiate FusionCharts class
var sharedPie:FusionCharts = new FusionCharts();
//Set chart SWF folder
sharedPie.FCFolder = "fusioncharts";
//Set chart type to pie
sharedPie.FCChartType = "Pie3D";
//Set chart data URL
sharedPie.FCDataURL = "PieData.xml";
//Set chart position, width and height
sharedPie.x = 430;
sharedPie.y = 50;
sharedPie.FCChartWidth = 400;
sharedPie.FCChartHeight = 240;
//Render chart
sharedPie.FCRender();
//Add chart to display hierarchy
this.addChild(sharedPie);
stop();
In the above code we have done the following:
- Imported FusionCharts loader class from com.fusioncharts.components
- Created 2 instances of FusionCharts class - one each for Column and Pie chart
- Configure each instance's chart type, source SWF folder path, width and height
- Pass the chart data to the charts (for Column we pass SalesData.xml where as for Pie its PieData.xml which we have copied from SalesData.xml). This was done by setting FCDataURL property of the FusionCharts loader class. For setting XML as string, FCDataXML property can be used.
- Render the charts
- Finally, add the chart to display hierarchy using addChild() function
Once published, the movie will load up in HTML with the charts like the image shown below. If the charts do not show up, please make sure that you've enabled Flash-JavaScript communication for the folder in which you've compiled the files. This is necessary as ExternalInterface is used to communicate with the charts.
Note that the movie won't load the charts when you use Test Movie option from Control menu of Flash. You need to Publish and then load the movie from the published HTML file or embed it in any HTML file. This is because ExternalInterface doesn't work in Test Movie mode.
FusionCharts loader class provides the following properties, methods and events:
| Property Name | Description |
| FCChartType | This property lets you set the type of the chart. The list of all available chart types is given in 'List of Charts' table below. |
| FCChartWidth | This property lets you set the width of the chart. You need to specify the chart with as a number in pixels (without px). |
| FCChartHeight | This property lets you set the height of the chart. You need to specify the chart height as a number in pixels (without px). |
| FCDataURL | This property helps you to provide the path of your external XML file needed to build the chart. |
| FCDataXML | It enables you to pass the entire chart XML as string. |
| FCDebugMode | This attribute lets you open a debug window on top of chart. It takes either of the two value, true or false. If it is set to true, the debug window will open up. The default value is false. |
| FCFolder | This attribute sets the folder where the chart SWF files are kept. By default, FusionCharts component assumes that the charts are present in "fusioncharts" folder Flash application files is present. But, the developer can always decide to keep the chart SWF files in some other folder. The value of this attribute would be a path relative to the application file's folder. Example: "." - when the chart SWF files resides in the same folder as the Flash application file. "myCharts" - charts are in a folder named "myCharts" inside the Flash application file's folder. "resources\charts" - charts are in "charts" folder inside "resources" folder. The "resources" folder is placed in folder where Flash application file is present. |
| Method Name | Parameters | Description |
| FCSetDataURL (dataURL:String):void |
dataURL:String | This function updates chart XML from a file and renders the chart. The URL of the file is passed as String parameter - dataURL. |
| FCSetDataXML (strXML:Sting):void |
strXML:String | This function updates chart XML from a string and renders the chart. The XML is passed as String parameter is passed as the parameter strXML. |
| FCRender():void | This function renders a chart. It can also update a chart after new chart data is set using FCData(), FCSetDataXML(), FCSetDataURL() methods or using FCDataURL, FCDataXML properties. | |
| FCPrintChart():void | It prints the chart. | |
| FCGetAttribute (attributeName:String):String |
attributeName:String | Returns the value of an attribute specified by the parameter. |
| FCGetCSVData():String | Returns the chart data-plot data as a CSV string. | |
| FCGetSignature():String | Returns the version of the chart being used. | |
| FCGetXMLData():String | Returns the XML data of the chart as a string. | |
| FCExportChart(type:String, fileName:String):void | type: String fileName: String |
Calls the export chart routine to save the chart as PDF/image. Parameters may be passed to override the export parameters initially specified by the XML. This function fires FCExported event. |
| Event Name | Description |
| FCClickEvent | Whenever a user clicks on a dataplot, which has link attribute that starts with 'S-', this event is triggered. |
| FCRenderEvent | When the chart finishes rendering, this event is triggered. |
| FCLoadEvent | This event is triggered after the chart data gets loaded completely before rendering starts. |
| FCExported | This event is generated after the completion of the image export process. |
| FCDataLoadedEvent | The event is dispatched after the chart data is loaded. The event is independent of the data source viz. FCData, FCDataXML, FCDataURL. |
| FCDataLoadErrorEvent | This event is dispatched if the chart fails to load data. Generally caused due to invalid or empty data sources. |
| FCDataXMLInvalidEvent | This event is generated if the data source does not conform to FusionCharts XML. |
| FCNoDataToDisplayEvent | Whenever the dataset consists of just the root element without any additional data, this event is generated. |
Use the following available types of charts as FCChart property:
| Chart Name | Chart Type (value for FCChartType property) | Chart File Name (SWF) | |
| Single Series Charts | |||
| Column 2D | Column2D | Column2D.swf | |
| Column 3D | Column3D | Column3D.swf | |
| Pie 3D | Pie3D | Pie3D.swf | |
| Pie 2D | Pie2D | Pie2D.swf | |
| Line 2D | Line | Line.swf | |
| Area 2D | Area2D | Area2D.swf | |
| Bar 2D | Bar2D | Bar2D.swf | |
| Doughnut 2D | Doughnut2D | Doughnut2D.swf | |
| Doughnut 3D | Doughnut3D | Doughnut3D.swf | |
| Multi-series Charts | |||
| Multi-series Column 2D | MSColumn2D | MSColumn2D.swf | |
| Multi-series Column 3D | MSColumn3D | MSColumn3D.swf | |
| Multi-series Line 2D | MSLine | MSLine.swf | |
| Multi-series Area 2D | MSArea | MSArea.swf | |
| Multi-series Bar 2D | MSBar2D | MSBar2D.swf | |
| Multi-series Bar 3D | MSBar3D | MSBar3D.swf | |
| Stacked Charts | |||
| Stacked Column 2D | StackedColumn2D | StackedColumn2D.swf | |
| Stacked Column 3D | StackedColumn3D | StackedColumn3D.swf | |
| Stacked Area 2D | StackedArea2D | StackedArea2D.swf | |
| Stacked Bar 2D | StackedBar2D | StackedBar2D.swf | |
| Stacked Bar 3D | StackedBar3D | StackedBar3D.swf | |
| Combination Charts | |||
| 3D Single Y Combination | MSCombi3D | MSCombi3D.swf | |
| 2D Single Y Combination | MSCombi2D | MSCombi2D.swf | |
| 2D Dual Y Combination | MSCombiDY2D | MSCombiDY2D.swf | |
| Column 3D Line (Single Y) Combination | MSColumnLine3D | MSColumnLine3D.swf | |
| Multi-series Column 3D Line Dual Y Combination | MSColumn3DLineDY | MSColumn3DLineDY.swf | |
| Stacked Column 3D Line Dual Y Combination | StackedColumn3DLineDY | StackedColumn3DLineDY.swf | |
| Scroll Charts | |||
| Scroll Column 2D | ScrollColumn2D | ScrollColumn2D.swf | |
| Scroll Line 2D | ScrollLine2D | ScrollLine2D.swf | |
| Scroll Area 2D | ScrollArea2D | ScrollArea2D.swf | |
| Scroll Stacked Column 2D | ScrollStackedColumn2D | ScrollStackedColumn2D.swf | |
| Scroll Combination 2D | ScrollCombi2D | ScrollCombi2D.swf | |
| Scroll Combination 2D Dual Y | ScrollCombiDY2D | ScrollCombiDY2D.swf | |
| XY Plot Charts | |||
| Scatter | Scatter | Scatter.swf | |
| Bubble | Bubble | Bubble.swf | |