Starting FusionCharts v3.2, FusionCharts also allows you to create JavaScript based charts (sometimes also referred to as HTML5/Canvas charts). This feature allows you to create charts in web browsers where Flash Player is not supported e.g. in iPhone/iPad. FusionCharts internally makes use of Highcharts library to generate JavaScript based charts. This feature works seamlessly with the current implementation mode of FusionCharts, which means you do not have to write any additional code to implement this. FusionCharts.js JavaScript class automatically detects devices where Flash is not supported and renders JavaScript based charts instead. You can also ignore Flash and only use JavaScript for charting.
First, let's look at the default code, which enables rendering of both Flash and JavaScript based charts - with JavaScript rendering coming into effect, only when Flash Player is not available.
<html>
  <head>
    <title>My First chart using FusionCharts - Using JavaScript</title>
    <script type="text/javascript" src="FusionCharts/FusionCharts.js"></script>
  </head>
  <body>
    <div id="chartContainer">FusionCharts will load here!</div>
    <script type="text/javascript"><!--

      var myChart = new FusionCharts( "FusionCharts/Column3D.swf",
		    "myChartId", "400", "300", "0", "1" );
      myChart.setXMLUrl("Data.xml");
      myChart.render("chartContainer");
    // -->
    </script>
  </body>
</html>
See it live in case you open it in iPhone/iPad/iPod.
As you can see, the code has not changed a bit from our first sample - weekly-sales.html That's exactly our point! If you open this page in your iPad or iPhone or any browser where Flash Player is not supported, you will see that the charts have been rendered using JavaScript. FusionCharts JavaScript framework automatically does this for you.
In case you wish to render only JavaScript based charts (and not use Flash at all), you just have to add a line of code as shown below: FusionCharts.setCurrentRenderer('javascript').
This code will ask FusionCharts renderer to skip Flash rendering and create pure JavaScript based charts.
The modified code will look like the following:
<html>
  <head>
    <title>My First chart using FusionCharts - Using pure JavaScript</title>
    <script type="text/javascript" src="FusionCharts/FusionCharts.js"></script>
  </head>
  <body>
    <div id="chartContainer">FusionCharts will load here!</div>
    <script type="text/javascript"><!--

      FusionCharts.setCurrentRenderer('javascript');

      var myChart = new FusionCharts( "FusionCharts/Column3D.swf",
		    "myChartId", "400", "300", "0", "1" );
      myChart.setXMLUrl("Data.xml");
      myChart.render("chartContainer");

    // -->
    </script>
  </body>
</html>
See it live!
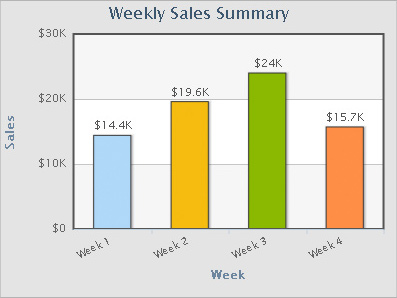
When you open this page, you would see that even in regular browsers, the chart comes in pure JavaScript form as shown below.
<div id="chartContainer">FusionCharts will load here!</div>
<script type="text/javascript"><!--

      FusionCharts._fallbackJSChartWhenNoFlash();

      var myChart = new FusionCharts( "FusionCharts/Column3D.swf",
		    "myChartId", "400", "300", "0", "1" );
      myChart.setXMLUrl("Data.xml");
      myChart.render("chartContainer");

    // -->
</script>