You can easily embed any number of charts in a single HTML page (or web page). You can even combine charts from FusionCharts and PowerCharts, maps from FusionMaps, and gauges from FusionWidgets in the same page.
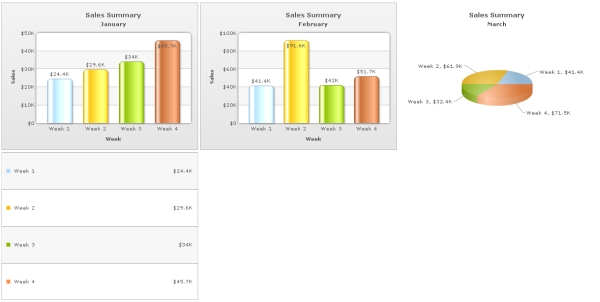
In this example, we'll add 3 charts and a grid component to a page. Three charts showing weekly sales for months -January (Column2D), February (Column2D) March (Pie3D), and an additional Gird component showing weekly sales for January. The page will look like the image below:
Code examples and data files discussed in this section are present in Download Package > Code > MyFirstChart folder. We have used multiple xml files for this sample which are also present in the same folder.
The process of embedding multiple charts is similar to that of embedding a single chart. You just need to take care of the following:
- Each chart on the page should have a unique DOM-Id (which is specified in the JavaScript constructor).
- Each chart should be denoted by a unique JavaScript variable name (e.g., var chart1 = new FusionCharts (...); var chart2 = new FusionCharts(...); ).
- Each chart should be rendered in separate HTML container (DIV, SPAN etc), each container having unique id. The chart embedding code must contain a reference to the ID of the container where the chart is to be rendered ( render("chart1div") ; .. render("chart2Div"); ).
The following sample code embeds three charts into a single HTML page (weekly-sales-multiple-charts.html) :
<html>
  <head>
    <title>My First chart using FusionCharts - multiple charts</title>
    <script type="text/javascript" src="FusionCharts/FusionCharts.js"></script>
  </head>
  <body>
    <span id="chartContainerJan">January Column 2D Chart will load here</span>
    <span id="chartContainerFeb">February Column 2D Chart will load her</span>
    <span id="chartContainerMarch">March Pie Chart will load here</span>
    <div id="gridContainerJan">January Grid will load here</span>

    <script type="text/javascript"><!--

      var JanChart = new FusionCharts("FusionCharts/Column2D.swf", "JanChartId",
        "400", "300", "0", "1");
      JanChart.setXMLUrl("Data-Jan.xml");
      JanChart.render("chartContainerJan");

      var JanGrid = new FusionCharts("FusionCharts/SSGrid.swf", "JanGridId",
        "400", "300", "0", "1");
      JanGrid.setXMLUrl("Data-Jan.xml");
      JanGrid.render("gridContainerJan");

      var FebChart = new FusionCharts("FusionCharts/Column2D.swf", "FebChartId",
        "400", "300", "0", "1");
      FebChart.setXMLUrl("Data-Feb.xml");
      FebChart.render("chartContainerFeb");

      var MarChart = new FusionCharts("FusionCharts/Pie3D.swf", "MarChartId",
        "400", "300", "0", "1");
      MarChart.setXMLUrl("Data-Mar.xml");
      MarChart.render("chartContainerMarch");

    // -->
    </script>

</body>
</html>
See it live!
In the above code we've embedded four charts in a single page - two 2D column charts, a 3D pie chart and a Grid component. Each having unique DOMIds - JanChartId, JanGridId, FebChartId and MarChartId. Each FusionCharts JavaScript object has a unique name - JanChart, JanGrid, FebChart and MarChart. There are four HTML containers (three SPAN elements and one DIV element) where each of the four charts are rendered. Each element also has unique id - chartContainerJan, chartContainerFeb, chartContainerMarch and gridContainerJan.