The debug mode is a new concept introduced in FusionCharts v3. It helps you look into what is happening behind the chart scenes. It also lists out any errors, if present. You can use the debug window to trouble shoot all your charts. The debug window lists errors like:
- Error in loading data - reasons.
- No data to display - possible reasons.
- Invalid XML data - 10 possible reasons.
- If invalid style names are specified for Chart OBJECTS.
- If invalid macros are used for animations using STYLE.
- and a few more...
In each FusionCharts v3 chart, you can activate the debug mode by just enabling the debug flag. A typical debug window for a chart that rendered successfully using dataURL method looks as under:
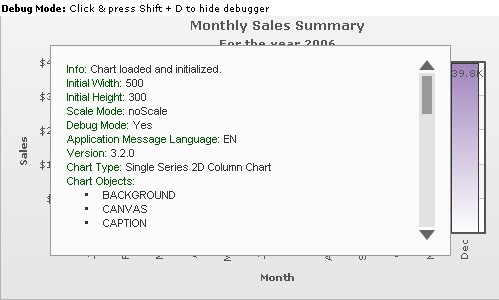
Here, you can see a Column 2D Chart with its Debug Window. The Debug Window contains a lot of information about the chart. The contents of the above debug window can be listed as under:
Initial Width: 500
Initial Height: 300
Scale Mode: noScale
Debug Mode: Yes
Application Message Language: EN
Version: 3.2.0
Chart Type: Single Series 2D Column Chart
Chart Objects:
- BACKGROUND
- CANVAS
- CAPTION
- SUBCAPTION
- YAXISNAME
- XAXISNAME
- DIVLINES
- YAXISVALUES
- HGRID
- DATALABELS
- DATAVALUES
- TRENDLINES
- TRENDVALUES
- DATAPLOT
- TOOLTIP
- VLINES
- VLINELABELS
INFO: XML Data provided using dataURL method.
dataURL provided: Data.xml
dataURL invoked: Data.xml?FCTime=139
XML Data:
<chart caption="Monthly Sales Summary" subcaption="For the year 2006" xAxisName="Month" yAxisName="Sales" numberPrefix="$">
  <set label="Jan" value="17400" />
  <set label="Feb" value="19800" />
  <set label="Mar" value="21800" />
  <set label="Apr" value="23800" />
  <set label="May" value="29600" />
  <set label="Jun" value="27600" />
  <set label="Jul" value="31800" />
  <set label="Aug" value="39700" />
  <set label="Sep" value="37800" />
  <set label="Oct" value="21900" />
  <set label="Nov" value="32900" />
  <set label="Dec" value="39800" />
</chart>
From the above Debug Window, you can get the following information:
- A message when chart is loaded and initialized properly.
- Specified width and height.
- Scale Mode, Debug Mode, Application Message Language.
- Chart Version - The version of chart you're using.
- Chart Type - The name of the chart you're using (Single Series 2D Column Chart in this example).
- Objects supported by chart - This is to help you quickly refer to a chart object without going through individual Chart XML Sheets.
- Method using which XML data has been provided - Can be dataURL or dataXML.
- If dataURL method, then link to original dataURL provided and the invoked one. There could be a difference between the two, if your dataURL is URL-Encoded. In that case, FusionCharts converts it into normal form before invoking it. If you get an error in loading data, you can see here if FusionCharts is invoking the right Url. You can also click on the Url to open the page in browser to see any errors thrown by your server side scripting language.
- Finally the XML data retrieved is shown for your reference.
While in Debug Mode, in order to hide the debug window and see the chart below, you can click inside the respective chart and then press Shift + D. To toggle back to the Debug Mode, you would have to press Shift + D again.
To enable the debug mode for any of your charts, you just need to set the debugMode flag to 1. If you're using FusionCharts JavaScript class, you can set the debugMode flag to 1 as under:
<div id="chartdiv" align="center">The chart will appear within this DIV. This text will be replaced by the chart.</div>
  <script type="text/javascript"><!--
    var myChart = new FusionCharts("../FusionCharts/Column2D.swf", "myChartId", "600", "300", "1", "1");
    myChart.setXMLUrl("Data.xml");
    myChart.render("chartdiv");
// -->
  </script>
Or, if you're using direct HTML embedding mode, you can provide it as under:
<object classid="clsid:d27cdb6e-ae6d-11cf-96b8-444553540000" codebase="http://fpdownload.macromedia.com/pub/shockwave/cabs/flash/swflash.cab#version=8,0,0,0"
  width="500" height="300" id="Column2D" >
  <param name="movie" value="../FusionCharts/Column2D.swf"/>
  <param name="FlashVars" value="&dataURL=Data.xml&debugMode=1">
  <param name="quality" value="high"/>
  <embed src="../FusionCharts/Column2D.swf" flashVars="&dataURL=Data.xml&debugMode=1"
    quality="high" width="500" height="300" name="Column2D"
    type="application/x-shockwave-flash" pluginspage="http://www.macromedia.com/go/getflashplayer" />
</object>
The parameter after chart width and height is the debugMode flag. Set it to 1, and run the chart. You'll now see it with Debug Window, positioned over the chart.
It is recommended to use the debug window when building the chart for the first time. Once the chart runs fine, set the flag back to 0, so that your end users just see the chart and not the debug window.
Note: Debug Mode error won't help you solve problems relating to path of SWF file, as the debug mode is a module inside the chart SWF file. So, unless the SWF file path is correct, you cannot switch debug mode on.
Shown below are a few example errors show in debug mode:
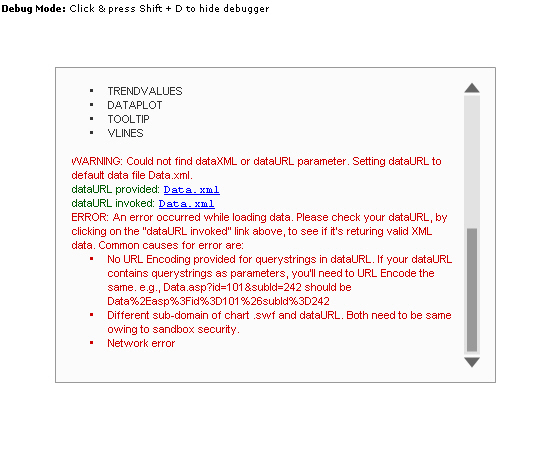
In this chart, we've:
- NOT specified either dataURL or dataXML. So you can see the Warning above.
- NOT placed a default Data.xml file in the folder. So, FusionCharts tries to look for a Data.xml file, but it cannot find it. Thereby, you get an "Error in Loading Data" message, and the debug window lists the possible reasons for the error.
In this example, we provide invalid XML to the chart. We've intentionally not closed one of our <set> elements. The entire XML is listed below:
<chart caption='Monthly Sales Summary' subcaption='For the year 2006' xAxisName='Month' yAxisName='Sales' numberPrefix='$'>
  <set label='Jan' value='17400' />
  <set label='Feb' value='19800' />
  <set label='Mar' value='21800' />
  <set label='Apr' value='23800' >
  <set label='May' value='29600' />
  <set label='Jun' value='27600' />
  <set label='Jul' value='31800' />
  <set label='Aug' value='39700' />
  <set label='Sep' value='37800' />
  <set label='Oct' value='21900' />
  <set label='Nov' value='32900' />
  <set label='Dec' value='39800' />
</chart>
When you run your chart against this XML, you'll get an "Invalid XML Data" message on the chart and the debug window would look as under:
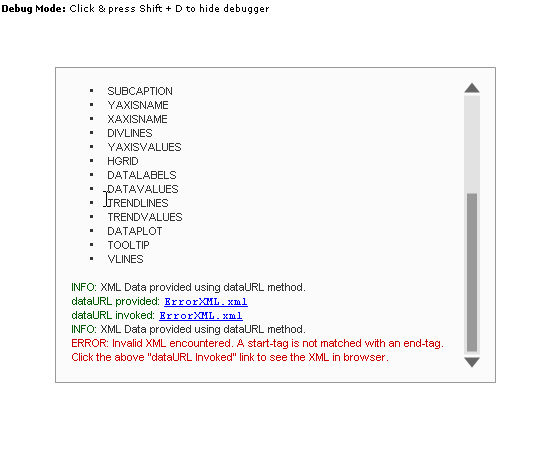
You can see the reason for Invalid XML data above. FusionCharts detects it for you and then shows the appropriate message.
To get more information on error, you can click the dataURL Invoked link and open the XML file in browser.
FusionCharts Debug Window can also capture the following errors in your STYLE definitions:
- Invalid STYLE types.
- Invalid Macro Names in animation parameter.
- Invalid Chart Object Names.
- Usage of undefined Style Objects by Chart objects.
Let's consider the XML example below. Errors in style XML are represented in bold:
<chart caption='Monthly Sales Summary' subcaption='For the year 2006' xAxisName='Month' yAxisName='Sales' numberPrefix='$'>
  <set label='Jan' value='17400' />
  <set label='Feb' value='19800' />
  <set label='Mar' value='21800' />
  <set label='Apr' value='23800' />
  <set label='May' value='29600' />
  <set label='Jun' value='27600' />
  <set label='Jul' value='31800' />
  <set label='Aug' value='39700' />
  <set label='Sep' value='37800' />
  <set label='Oct' value='21900' />
  <set label='Nov' value='32900' />
  <set label='Dec' value='39800' />

  <styles>
    <definition>
      <style name='CaptionFont' type='Font' font='Verdana' size='13' />
      <style name='WrongAnimation' type='Animation' param='_x' start='$canvasWrongX' duration='1'/>
      <style name='MyWrongType' type='MyOwnType' color='FF5904'/>
    </definition>
    <application>
      <apply toObject='CAPTION' styles='CaptionFont' />
      <apply toObject='MYSUBCAPTION' styles='CaptionFont' />
      <apply toObject='CANVAS' styles='WrongAnimation' />
      <apply toObject='DATALABELS' styles='MyWrongType' />
    </application>
  </styles>
</chart>
Here, we've the following errors in style XML:
- $canvasWrongX is not a valid macro name.
- Style type MyOwnType is an invalid type for Style.
- MySubCaption is an invalid chart object.
When you run a chart against this XML, you'll see the following errors raised in debug mode:
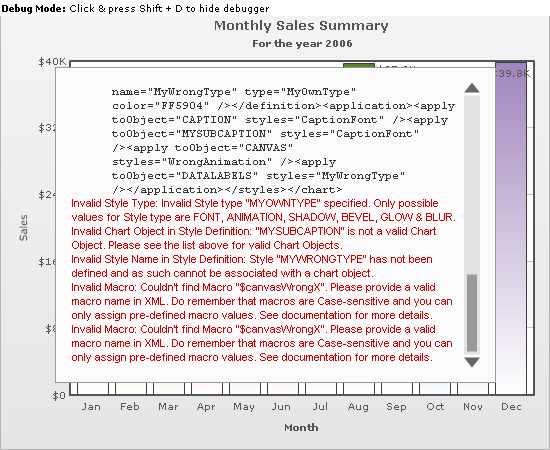
As you can see, all our errors got caught in the Debug Window and now you can use this effectively to correct your style XML.
There are more errors and messages that debug window can trap, which we've not shown here.
Example: When you update your chart's data at client using AJAX, all transfer messages are logged so that you easily debug into the application process.
The Debug Window is aimed at making your lives simpler as developers.
Next, we'll see how to use the JavaScript class to trouble shoot.