The Zoom Line chart is essentially a multi-series line chart with intuitive zooming, scrolling and pinning capabilities. It can handle large datasets (of tens of thousands of points) easily.
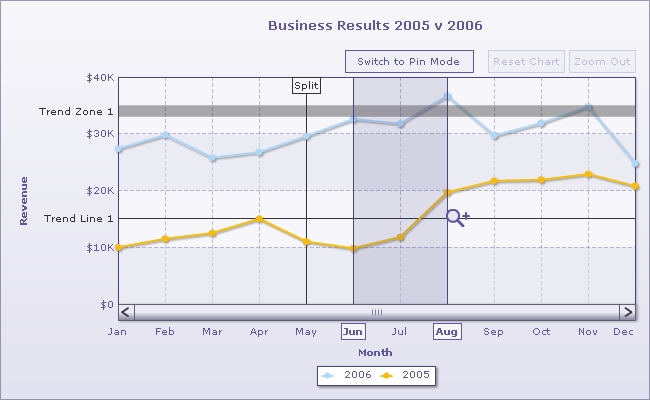
Shown below is a sample Zoom Line chart:
Zoom Line Chart can accept JSON data in two formats:
- Standard Multi-series JSON Data: The advantage of this format is that you do not need to change your existing code. Additionally, you can specify displayValue and toolText for each point. However, for large datasets using this format, the JSON gets big in size and takes a lot of time to parse. Use this format when you've less than 1,000 data points to show on the chart.
- Compact JSON data: This is a new data format specifically introduced for zoom chart. Using this format, you can provide tens of thousands of data points. This format reduces the JSON size and parsing time. Use this format when you've more than 1,000 data points to show on the chart.
Let's have a look at the JSON data for a Zoom Line chart:
Since the standard Multi-series JSON format has already been discussed, we will skip this and proceed with compact JSON data format:
{
  "chart":{
    "caption":"Web visits",
    "compactdatamode":"1",
    "dataseparator":"|"
  },
  "categories":[{
      "category":[ "Jan|Feb|Mar|Apr|May|Jun|Jul|Aug|Sep|Oct|Nov|Dec" ]
    }
  ],
  "dataset":[{
      "seriesname":"2006",
      "data":[ "27400|29800|25800|26800|29600|32600|31800|36700|29700|31900|34800|24800" ]
    },
    {
      "seriesname":"2005",
      "data":[ "10000|11500|12500|15000|11000|9800|11800|19700|21700|21900|22900|20800" ]
    }
  ],
"trendlines": {
    "line": [
      {
        "startvalue": "15000",
        "displayvalue": "Trend Line 1"
      },
      {
        "startvalue": "33000",
        "endvalue": "35000",
        "istrendzone": "1",
        "displayvalue": "Trend Zone 1",
        "showontop": "1",
      }
    ]
  },
  "vtrendlines": {
    "line": [
      { "startindex": "5", "displayalways": "1", "displayvalue": "Split", "valueontop": "1" },
      {
        "index": "30",
        "displayalways": "0",
        "displaywhencount": "20",
        "displayvalue": "Dividend",
        "dashed": "1",
        "showontop": "1",
        "color": "FF5904",
        "thickness":"2",
        "dashlen": "3",
        "dashgap": "3"
      }
    ]
  }
}
When specifying data in compact mode, you'll necessarily need to specify two attributes in the chart object:
- "compactDataMode":"1" : This tells the chart that data has been specified in compact mode.
- "dataSeparator"="|" : This specifies the separator character that will be used to separate labels and data. In the example above, we've used the | (pipe) character. You can use comma, semi-colon or any other character. Just make sure that the character is not a part of any label text.
The Zoom Line chart supports horizontal trend lines (trendlines and zones) like a standard multi-series chart. However, it supports index based vertical trend lines (vtrendlines) that can be displayed conditionally based on what level of zoom the user has applied on the chart. Following is the JSON code for a vertical trendline:
{
  "startindex": "5",
  "displayalways": "1",
  "displayvalue": "Split",
  "valueontop": "1"
}
The above vertical trendline has an attribute displayAlways='1' which instructs the chart to show the trendlines at all times, irrespective of level of zoom the chart is being viewed at. Also, the position of trend line is specified in indexes (startIndex and endIndex). Index is based on the number of data items plotted on x-axis (category). The first x-axis label has an index of 1.
Following is the JSON code for a conditional vertical trendline:
{
  "index": "30",
  "displayalways": "0",
  "displaywhencount": "20",
  "displayvalue": "Dividend",
  "dashed": "1",
  "showontop": "1",
  "color": "FF5904",
  "thickness": "2",
  "dashlen": "3",
  "dashgap": "3"
}
This line has an additional attribute "displayWhenCount":"20" that instructs the chart to show the trendline only when the user has zoomed into the chart -such that only 20 or lesser number of data points are visible in single screen.
The zoom line chart does not support certain features/attributes which are standard in FusionCharts. This is has been done to facilitate plotting of large datasets. They are:
- Compact data format does NOT support displayValue and toolText for each data item. However, standard data format does accept it
- Input number formatting is not present in this chart (i.e., where numbers could be provided in European format and the chart converted them to standard numeric format)
- Linking of individual data points is not supported in this chart, as click action is causes zooming
- vLines are not supported in this chart, you can use vTrendLines instead
- Tooltips are not supported on trend lines
- Animation is not supported in this chart
- Individual <set> anchors cannot be customized. The customization can only be done at <dataset> level