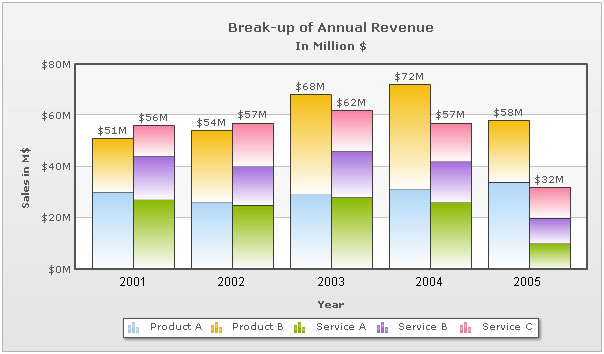
Multi-series stacked charts are useful when you have to show clustered stacked columns for every x-axis category. An example is shown below:
The JSON for the above chart looks as under:
{
  "chart":{
    "caption":"Annual Revenue",
    "subcaption":"In Million $",
    "xaxisname":"Year",
    "pyaxisname":"Sales in M$",
    "syaxisname":"Cost as % of Revenue",
    "decimals":"0",
    "numberprefix":"$",
    "numbersuffix":"M",
    "snumbersuffix":"%25"
  },
  "categories":[{
      "category":[
        { "label":"2001"   },
        { "label":"2002"   },
        { "label":"2003"   },
        { "label":"2004"   },
        { "label":"2005"   }
      ]
    }
  ],
  "dataset":[{
      "dataset":[{
          "seriesname":"Product A",
          "color":"AFD8F8",
          "showvalues":"0",
          "data":[
            {  "value":"30"  },
            {  "value":"26"  },
            {  "value":"29"  },
            {  "value":"31"  },
            {  "value":"34"  }
          ]
        },
        {
          "seriesname":"Product B",
          "color":"F6BD0F",
          "showvalues":"0",
          "data":[
            {  "value":"21"  },
            {  "value":"28"  },
            {  "value":"39"  },
            {  "value":"41"  },
            {  "value":"24"  }
          ]
        }
      ]
    },
    {
      "dataset":[{
          "seriesname":"Service A",
          "color":"8BBA00",
          "showvalues":"0",
          "data":[
            {  "value":"27"  },
            {  "value":"25"  },
            {  "value":"28"  },
            {  "value":"26"  },
            {  "value":"10"  }
          ]
        },
        {
          "seriesname":"Service B",
          "color":"A66EDD",
          "showvalues":"0",
          "data":[
            { "value":"17"  },
            { "value":"15"  },
            { "value":"18"  },
            { "value":"16"  },
            { "value":"10"  }
          ]
        },
        {
          "seriesname":"Service C",
          "color":"F984A1",
          "showvalues":"0",
          "data":[
            { "value":"12" },
            { "value":"17" },
            { "value":"16" },
            { "value":"15" },
            { "value":"12" }
          ]
        }
      ]
    }
  ]
}The JSON structure of multi-series stacked chart is similar to that of a normal multi series chart except for a few elements.
Since multi-series stacked charts have multiple stacked columns category, all the series which form one stacked column are grouped together using nested dataset. This is done for each such cluster of stacked columns.
For example, in the above chart, we have two stacked data plots for each x-axis label. The first dataplot comprises of two data series with series name Product A and Product B. So the JSON of the first dataplot represents one dataset with two nested datasets each with series name Product A and Product B respectively.
An example of a Multi-series Stacked Column 2D Line Dual Y Combination Chart is given below:
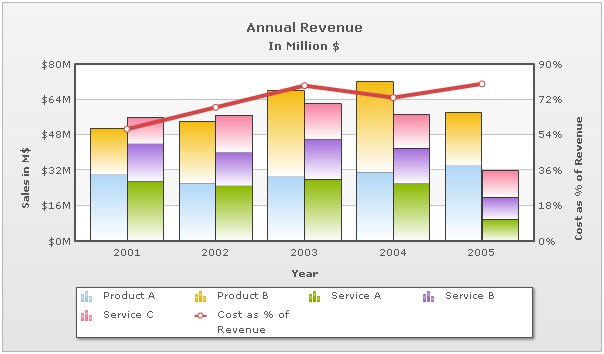
As you can see in the image above, there is a line combined with the multi series stacked chart. To define the line lineset object has to be defined in the JSON.
The JSON for the above Dual Y Multi series Stacked Combination chart looks as under:
{{
  "chart":{
    "caption":"Annual Revenue",
    "subcaption":"In Million $",
    "xaxisname":"Year",
    "pyaxisname":"Sales in M$",
    "syaxisname":"Cost as % of Revenue",
    "decimals":"0",
    "numberprefix":"$",
    "numbersuffix":"M",
    "snumbersuffix":"%25"
  },
  "categories":[{
      "category":[
        { "label":"2001"   },
        { "label":"2002"   },
        { "label":"2003"   },
        { "label":"2004"   },
        { "label":"2005"   }
      ]
    }
  ],
  "dataset":[{
      "dataset":[{
          "seriesname":"Product A",
          "color":"AFD8F8",
          "showvalues":"0",
          "data":[
            {  "value":"30"  },
            {  "value":"26"  },
            {  "value":"29"  },
            {  "value":"31"  },
            {  "value":"34"  }
          ]
        },
        {
          "seriesname":"Product B",
          "color":"F6BD0F",
          "showvalues":"0",
          "data":[
            {  "value":"21"  },
            {  "value":"28"  },
            {  "value":"39"  },
            {  "value":"41"  },
            {  "value":"24"  }
          ]
        }
      ]
    },
    {
      "dataset":[{
          "seriesname":"Service A",
          "color":"8BBA00",
          "showvalues":"0",
          "data":[
            {  "value":"27"  },
            {  "value":"25"  },
            {  "value":"28"  },
            {  "value":"26"  },
            {  "value":"10"  }
          ]
        },
        {
          "seriesname":"Service B",
          "color":"A66EDD",
          "showvalues":"0",
          "data":[
            { "value":"17"  },
            { "value":"15"  },
            { "value":"18"  },
            { "value":"16"  },
            { "value":"10"  }
          ]
        },
        {
          "seriesname":"Service C",
          "color":"F984A1",
          "showvalues":"0",
          "data":[
            { "value":"12" },
            { "value":"17" },
            { "value":"16" },
            { "value":"15" },
            { "value":"12" }
          ]
        }
      ]
    }
  ],
  "lineset":{
    "seriesname":"Cost as % of Revenue",
    "showvalues":"0",
    "linethickness":"4",
    "data":[
      { "value":"57" },
      { "value":"68" },
      { "value":"79" },
      { "value":"73" },
      { "value":"80" }
    ]
  }
}The JSON structure of multi-series Stacked Column 2D Line Dual Y Combination Charts is similar to that of a multi-series Stacked Column 2D Chart with the addition of lineset element. There can be multiple lineset elements per chart, each indicating a series of line to be plotted over column chart.
Also, since this chart has dual y-axis, you'll need to configure the titles, limits, number formatting and prefix/suffix for each axis separately.