In this section, we'll show you how to use FusionCharts and Ruby to plot charts from data contained in Ruby arrays. We'll create the following charts using data contained in arrays:
- Single series
- Multi series
Before you go further with this page, we recommend you to please see the previous section "Basic Examples" as we start off from concepts explained in that page.
All code discussed here is present in
Controller : Download Package > Code > RoR > SampleApp > app > controllers > fusioncharts > array_example_controller.rb.
Rhtml : Download Package > Code > RoR > SampleApp > app > views > fusioncharts > array_example folder.
Single-series chart from arrays
Let us now plot a single-series chart from data contained in arrays. Take a look at the controller array_example_controller.rb and the view single_series.html.erb. Here is the code:
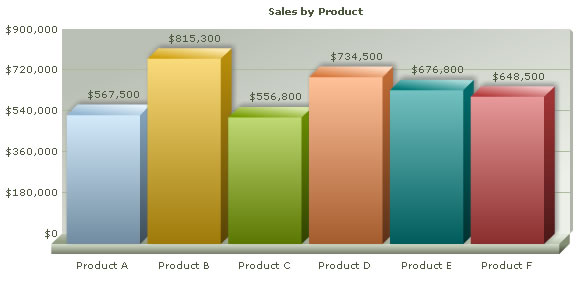
Controller: Fusioncharts::ArrayExampleController
Action: single_series
    # This controller class will show ways of generating chart by
    # * using sales data of products with their names present in an array.
    # * using sales data of products for current year and previous year with their names present in an array.
    # * using sales figure and quantity sold in each quarter of a year of a product present in an array.
    # * using sales information of two products in each quarter of a year present in an array .
    # All the views related to this controller will use the "common" layout.
    # As per Ruby On Rails conventions, we have the corresponding views with the same name as the function name in the controller.
      class Fusioncharts::ArrayExampleController < ApplicationController
        #This is the layout which all functions in the controller make use of.
        layout "common"
        #In this function, we plot a single series chart from data contained
        #in an array. Each element in the array will have two values - first one for data label
        #and the next one for data value.
        #The sales data and product names for 6 products are stored in the array.
        #These values in the array will be used by the builder to build an appropriate xml,
        #which is then rendered by the corresponding view.
          def single_series
            response.content_type = Mime::HTML
            @arr_data = []
            @arr_data << ['Product A','567500']
            @arr_data << ['Product B','815300']
            @arr_data << ['Product C','556800']
            @arr_data << ['Product D','734500']
            @arr_data << ['Product E','676800']
            @arr_data << ['Product F','648500']
          end
View:
    <%
      # The following three variables are used in the "common" layout
    %>
    <% @page_title=" FusionCharts - Array Example using Single Series Column 3D Chart " %>
    <% @page_heading=" FusionCharts Examples " %>
    <% @page_subheading="Plotting single series chart from data contained in Array." %>
    <%
      # The xml is obtained as a string from builder template.
      str_xml = render :file=>"fusioncharts/array_example/ss_array_data",:locals=>{:arr_data => @arr_data}
      #Create the chart - Column 3D Chart with data contained in str_xml
      render_chart '/FusionCharts/Column3D.swf', '', str_xml, 'productSales', 600, 300, false, false do-%>
    <% end -%>
Here are the steps:
- In the controller, define an array. Each element in this array, is itself an array (simulating a 2-dimensional array) containing the product name and sales value. We have constructed the array by pushing values into it for Product A to Product F and the corresponding sales value.
- Write the builder template to create an xml based on array values. (as shown below)
- In the view, we render the builder xml and assign it to a variable. Finally we call the render_chart function with the appropriate parameters including str_xml as the xml.
Builder - ss_array_data.builder
    #Creates xml with values for sales data of products
    #along with their names.
    #The values required for building the xml is obtained as parameter arr_data
    #It expects an array in which each element is
    #itself an array with first element as label and second element as value
    xml = Builder::XmlMarkup.new
    xml.chart(:caption=>'Sales by Product', :numberPrefix=>'$', :formatNumberScale=>'0') do
      for item in arr_data
        xml.set(:label=>item[0], :value=>item[1])
      end
    end
This is a simple chart xml with outermost <chart> tag, <set> tag inside it with attributes label and value. To build the <set> tags, we iterate through the array obtained as parameter from the view.
When you view the chart, you'll see a chart as under:
Multi-series chart from arrays
The code to create a multi series chart can be listed as under:
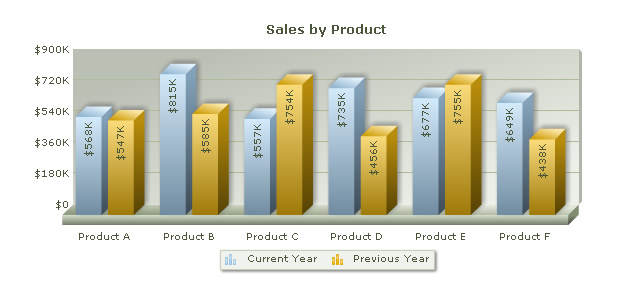
Controller: Fusioncharts::ArrayExampleController
Action: multi_series
  #In this function, we plot a multi-series chart from data contained
  #in an array. Each element in the array will have three values - first one for data label (product)
  #and the next one store sales information
  #for current year and the last one stores sales information for previous year.
  #The sales data and product names for 6 products are thus, stored.
  #These values in the array will be used by the builder to build an appropriate xml,
  #which is then rendered by the corresponding view.
  def multi_series
    response.content_type = Mime::HTML
    @arr_data = []
    @arr_data << ['Product A','567500','547300']
    @arr_data << ['Product B','815300','584500']
    @arr_data << ['Product C','556800','75400']
    @arr_data << ['Product D','734500','456300']
    @arr_data << ['Product E','676800','754500']
    @arr_data << ['Product F','648500','437600']
  end
View:
  <%
  # The following three variables are used in the "common" layout
  %>
  <% @page_title=" FusionCharts - Array Example using Multi Series Column 3D Chart " %>
  <% @page_heading=" FusionCharts Examples " %>
  <% @page_subheading="Plotting multi-series chart from data contained in Array." %>
  <%
    # The xml is obtained as a string from builder template.
    str_xml = render :file=>"fusioncharts/array_example/ms_array_data",:locals=>{:arr_data => @arr_data}
    #Create the chart - MS Column 3D Chart with data contained in str_xml
    render_chart '/FusionCharts/MSColumn3D.swf', '', str_xml, 'productSales', 600, 300, false, false do-%>
  <% end -%>
Steps involved:
- The controller code is very simple. We store the sales of 6 products in an array. For each product we store the name, sales in the current year and previous year in another array and append this array into the outer array.
- The view is similar to the single_series view that we had seen previously. We render the xml using the builder file ms_array_data.builder and assign it to a variable str_xml. This xml is passed to render_chart as parameter.
- The builder template contains the logic of creating the categories, dataset elements as described below.
Builder: ms_array_data.builder
    #Creates xml with values for sales data of products
    #for the current year and the previous year.
    #The values required for building the xml is obtained as parameter arr_data
    #It expects an array in which each element is
    #itself an array with first element as label, second element as current year sales value
    #and third element as previous year value
    xml = Builder::XmlMarkup.new
    xml.chart(:caption=>'Sales by Product', :numberPrefix=>'$', :formatNumberScale=>'1',
    :rotateValues=>'1', :placeValuesInside=>'1', :decimals=>'0') do
    # Iterate through the array to create the <category> tags within <categories>
      xml.categories do
        for item in arr_data
          xml.category(:name=>item[0])
        end
      end
    # Iterate through the array to create the <set> tags within dataset for series 'Current Year'
      xml.dataset(:seriesName=>'Current Year') do
        for item in arr_data
          xml.set(:value=>item[1])
        end
      end
  # Iterate through the array to create the <set> tags within dataset for series 'Previous Year'
      xml.dataset(:seriesName=>'Previous Year') do
        for item in arr_data
          xml.set(:value=>item[2])
        end
      end
  end
Now when you view the chart in the browser, you would see:
In Download Package > Code > RoR > app > controllers > fusioncharts > array_example_controller.rb, we've more example codes to create Stacked and Combination Charts too, which have not been explained here, as they're similar in concept. You can directly see the code and get more insight into it.