FusionCharts v3 offers tremendous integration capabilities with JavaScript. You can easily use FusionCharts and JavaScript to create client side dynamic charts.
Here, we'll see the JavaScript + Url method - where we ask the chart to fetch new data from server and update itself, without incurring any page refreshes. The entire application resides in a single page which makes it a seamless experience for your end viewers.
Before you proceed with the contents in this page, we strictly recommend you to please go through the sections "How FusionCharts works?" and "Basic Examples", as we'll directly use a lot of concepts defined in those sections.
All code discussed here is present in
Controller : Download Package > Code > RoR > SampleApp > app > controllers > fusioncharts > db_js_data_url_controller.rb.
Rhtml : Download Package > Code > RoR > SampleApp > app > views > fusioncharts > db_js_dataurl folder.
Mission for this example
Let us first define what we want to achieve in this example. We'll carry on from our previous drill-down example and convert it into a single page example. In our previous example, we were showing the Production Summary of all the factories in a pie chart. When the user clicked on a pie slice, he was taken to another page, where a detailed date-wise chart was shown for the required factory.
In this example, we'll assimilate both the charts in a single page and make them interact with each other using JavaScript, thereby making the end-user experience smooth. Effectively, we will do the following:
- Contain both the pie chart (summary) and column chart (detailed) in one page (default.html.erb).
- When the page loads, the pie chart would use dataStr method to show summary of all factories.
- The column chart would initialize with no data, as the user has not selected a factory initially. We'll customize the "No data to display" message of the chart to show a friendly message.
- The pie chart would have JavaScript links defined for each pie slice. This JavaScript links refer to updateChart() JavaScript function present on the same page. We'll later see how to hand code this function. When a pie is clicked, the factory ID is passed to this function.
- The updateChart() function is responsible for updating the column chart. It generates a dataURL link by including the factoryId as a part of dataURL. Once the dataURL is built, it conveys this dataURL to the column chart.
- The column chart would now accept this dataURL, the associated action factory_details is invoked to create XML data and finally render.
Creating the Controller For The First Chart
We have two actions in our Fusioncharts::DbJsDataurlController controller - default and detailed just like in our previous example. Then what is the difference? Let's take a look:Controller: Fusioncharts::DbJsDataurlController Action: default class Fusioncharts::DbJsDataurlController < ApplicationController #Default action. Used to show the pie chart #Finds the factories def default response.content_type = Mime::HTML # Expects a parameter called animate @animate_chart = params[:animate] if @animate_chart.nil? or @animate_chart.empty? # Assigns default values as '1' @animate_chart = '1' end @factories = Fusioncharts::FactoryMaster.find(:all) . . . end
We will see the view in a minute. Let us first assimilate what the controller is doing.
- Gets the request parameter animate and assigns it to the variable @animate_chart
- Performs a find on the Model FactoryMaster, selecting all the columns and stores it in @factories variable.
So, where is the link to the detailed chart created? Let's analyze the view.
Creating the View containing both the charts
View: (default.html.erb)
<HTML>
  <HEAD>
    <TITLE>FusionCharts - Database + JavaScript Example</TITLE>
    <%= javascript_include_tag "FusionCharts" %>
    <%   #You need to include the above JS file, if you intend to embed the chart using JavaScript.
    #When you make your own charts, make sure that the path to this
    #JS file is correct. Else, you would get JavaScript errors.
    %>
    <SCRIPT LANGUAGE="JavaScript">
    /**
    * updateChart method is invoked when the user clicks on a pie slice.
    * In this method, we get the index of the factory after which we request for XML data
    * for that that factory from FactoryData.asp, and finally
    * update the Column Chart.
    * @param factoryIndex id of the factory.
    */
  function updateChart(factoryIndex){
    //DataURL for the chart
    var strURL = "/Fusioncharts/db_js_dataurl/" + "factory_details/" + factoryIndex ;
    //Sometimes, the above Url and XML data gets cached by the browser.
    //If you want your charts to get new XML data on each request,
    //you can add the following line:
    //strURL = strURL + "&currTime=" + getTimeForURL();
    //getTimeForURL method is defined below and needs to be included
    //This basically adds a ever-changing parameter which bluffs
    //the browser and forces it to re-load the XML data every time.

   //Get reference to chart object using Dom ID "FactoryDetailed"
	 var chartObj = FusionCharts("FactoryDetailed");
		//Send request for XML
		chartObj.setXMLUrl(strURL);
  }
    /**
    * getTimeForURL method returns the current time
    * in a Url friendly format, so that it can be appended to
    * dataURL for effective non-caching.
    */
  function getTimeForURL(){
    var dt = new Date();
    var strOutput = "";
    strOutput = dt.getHours() + "_" + dt.getMinutes() +
    "_" + dt.getSeconds() + "_" + dt.getMilliseconds();
    return strOutput;
  }
  </SCRIPT>
  <style type="text/css">
  <!--
    body {
      font-family: Arial, Helvetica, sans-serif;
    font-size: 12px;
  }
  .text{
    font-family: Arial, Helvetica, sans-serif;
      font-size: 12px;
    }
    -->
  </style>
  </HEAD>
  <BODY>
    <CENTER>
      <h2>FusionCharts Database + JavaScript (dataURL method) Example</h2>
      <h4>Inter-connected charts - Click on any pie slice to see detailed
      chart below.</h4>
      <p>The charts in this page have been dynamically generated using
      data contained in a database.</p>
      <%
        # The xml is obtained as a string from builder template.
        str_xml = render :file=>"fusioncharts/db_js_dataurl/factories_quantity",
        :locals=>{:factories=>@factories}
        #Create the chart - Pie 3D Chart with data from str_xml
        render_chart '/FusionCharts/Pie3D.swf','',str_xml,'FactorySum',
        500, 250, false, false do-%>
      <% end -%>
      <BR>
      <%
       #Column 2D Chart with changed "No data to display" message
       #We initialize the chart with <chart></chart>
       #The last parameter to render_chart (registerWithJS) is set to true
        render_chart '/FusionCharts/Column2D.swf?ChartNoDataText=
        Please select a factory from pie chart above to view detailed
        data.','','<chart></chart>','FactoryDetailed',600, 250, false, true do-%>
      <% end -%>
      <BR><BR>
      <a href='/NoChart.html' target="_blank">Unable to see the charts above?</a>
    </CENTER>
  </BODY>
</HTML>
Note that this view does not use the "common" layout, as this view is quite different and has lot of javascript code too. Before we get to the JavaScript functions, let's first see what we're doing in our ruby code. This is the piece of code:
<%
# The xml is obtained as a string from builder template.
str_xml = render :file=>"fusioncharts/db_js_dataurl/factories_quantity",
:locals=>{:factories=>@factories}
#Create the chart - Pie 3D Chart with data from str_xml
render_chart '/FusionCharts/Pie3D.swf','',str_xml,'FactorySum', 500, 250, false, false do-%>
<% end -%>
<BR>
<%
#Column 2D Chart with "No data to display" message
#We initialize the chart with <chart></chart>
render_chart '/FusionCharts/Column2D.swf?ChartNoDataText=
Please select a factory from pie chart above to view detailed data.','',
'<chart></chart>','FactoryDetailed',600, 250, false, true do-%>
<% end -%>
Here as you can see, we have rendered two charts. For the first chart, we use the builder factories_quantity.builder to obtain the xml. Then call render_chart function to show a Pie3D chart with this xml as data. For the second chart, we chart Column2D chart with parameter ChartNoDataText and the initial xml <chart></chart>. This will initialize the chart to display the message on the screen just below the first chart.
The builder does the actual work of creating the link to the second chart. Like this:
    #Builds xml with values for factory output along with their names. It also creates
    #a link to javascript function updateChart which will be called when the pie slice is clicked.
    #The values required for building the xml is obtained from the factory data
    #passed as local parameter (factories).
    xml = Builder::XmlMarkup.new
    xml.chart(:caption=>'Factory Output report', :subCaption=>'By Quantity',
    :pieSliceDepth=>'30', :showBorder=>'1', :formatNumberScale=>'0',
    :numberSuffix=>' Units', :animation=>@animate_chart) do
      factories.each do|factory|
        xml.set(:label=>factory.name,:value=>factory.total_quantity,
        :link=>'javaScript:updateChart('+factory.id.to_s + ')')
      end
    end
Effectively, our page is now set to show two charts. The pie chart shows the summary data provided to it using dataStr method. The column chart shows the above "friendly" error message. Now, when each pie slice is clicked, the updateChart() JavaScript function is called and the factoryID of the pie is passed to it. This function is responsible for updating the column chart and contains the following code:
function updateChart(factoryIndex){
        //DataURL for the chart
        var strURL = "/Fusioncharts/db_js_dataurl/" + "factory_details/" + factoryIndex ;
        //Sometimes, the above Url and XML data gets cached by the browser.
        //If you want your charts to get new XML data on each request,
        //you can add the following line:
        //strURL = strURL + "&currTime=" + getTimeForURL();
        //getTimeForURL method is defined below and needs to be included
        //This basically adds a ever-changing parameter which bluffs
        //the browser and forces it to re-load the XML data every time.
   	//Get reference to chart object using Dom ID "FactoryDetailed"
		var chartObj = FusionCharts("FactoryDetailed");
		//Send request for XML
		chartObj.setXMLUrl(strURL);
  }
Here,
- We first create a dataURL string by appending the factoryID to the path to the detailed action factory_details.
- Finally, we convert this dataURL to the column chart. To do so, we first get a reference to the column chart using its DOM Id FactoryDetailed. We use the FusionCharts(DOMId) function defined in the JS API to do so.
- Once we've the reference to the chart, we simply call the setXMLUrl method of the chart and pass it the Url to request data from
- This updates the chart with new data.
This completes our front-end for the app. We now just need to build factory_details action and builder, responsible to provide detailed data to column chart. It contains the following code:
Controller: Fusioncharts::DbJsDataurlController
Action: factory_details
#This action will generate a chart to show the detailed information of the selected factory.
#Expects id as parameter in the request
def factory_details
  response.content_type = Mime::XML
  # Get the factoryId from request using params[]
  @factory_id = params[:id]
  factory = Fusioncharts::FactoryMaster. find(@factory_id)
  @factory_output_quantities = factory.factory_output_quantities
end
This action is same as the detailed action seen in the drill-down example. We basically request the factory Id passed to it as request parameter, query the database for required data. Note that the content-type of this action is "text/xml". response.content_type = Mime::XML. This data is used by the builder as shown:
    #Creates xml with values for date of production and quantity for a particular factory
    #It uses the @factory_output_quantities and @factory_id from the corresponding controller.
    #This data is used for building xml for chart with date of production and output quantity
    xml = Builder::XmlMarkup.new
    xml.chart(:palette=>'2', :caption=>'Factory' + @factory_id.to_s + ' Output ',
    :subcaption=>'(In Units)', :xAxisName=>'Date', :showValues=>'1', :labelStep=>'2') do
      @factory_output_quantities.each do |output|
        xml.set(:label=>output.formatted_date,:value=>output.quantity)
      end
    end
This is a simple xml with <set> tags within <chart> element. Each <set> element has attributes label and value. "label" attribute takes value of date of production and the attribute "value" has value as quantity. The values for the attributes are obtained from the hash present in the @factory_output_quantities variable of the controller. formatted_date method is present in the FactoryOutputQuantity model and it is used to format the date_pro field.
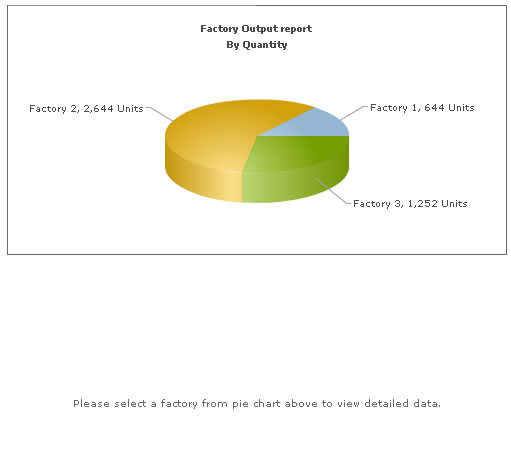
When you now see the application, the initial state would look as under:
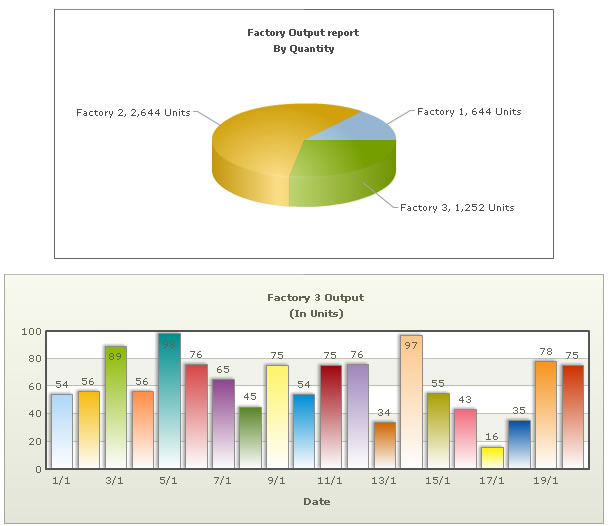
And when you click on a pie slice, the following would appear on the same page (without involving any browser refreshes):
This example demonstrated a very basic sample of the integration capabilities possible with FusionCharts v3. For advanced demos, you can see and download our FusionCharts Blueprint/Demo Applications.