In this section, we'll use AJAX in Ruby on Rails and generate dynamic charts. We'll do the following:
- Create a page which will contain two charts. First chart will list the factories and their total output. The second chart will show the details of factory in a Column chart.
- On clicking on the slice of pie from the first chart, the second chart updates to show the details of the selected factory.
Before you proceed with the contents in this page, we recommend you to go through the section "Basic Examples ".
All code discussed here is present in Controller : Download Package > Code > RoR > SampleApp > app > fusioncharts > controllers > ajax_example_controller.rb. View : Download Package > Code > RoR > SampleApp > app > views > fusioncharts > ajax_example folder. View Helper Modules: Download Package > Code > RoR > SampleApp > lib > fusion_charts_helper.rb
Creating the page with factory names drop-down and initial chart.
We will create a controller called AjaxExampleController with the action default_factories_chart for this page.
The code in the controller and view are given below.
Controller: Fusioncharts::AjaxExampleController Action: default_factories_chart class Fusioncharts::AjaxExampleController < ApplicationController # The data for the first chart is obtained and this is used in the corresponding builder and view files def default_factories_chart response.content_type = Mime::HTML @factories = Fusioncharts::FactoryMaster.find(:all) if(@factories.size>0) factory = @factories[0] @ factory_id = factory.id # Default factory factory = Fusioncharts::FactoryMaster.find(@factory_id) @factory_name = factory.name @factory_output_quantities = factory.factory_output_quantities end end View: default_factories_chart.html.erb <% #In this page, we will render two charts. The data for the first chart will be factories data from database #The second chart will be shown when clicked on a pie slice in the first chart. #This chart will show the details of the clicked factory.
#The mechanism followed here, is as follows: #Set the link attribute of the set element of the first chart's xml #to updateChart javascript function. #Pass the factory_id to this function as parameter. #In updateChart function, invoke the action factory_chart in ajax ( using jquery ). #The response obtained from this action will be the object tag that can be used to render the chart. #This response is written to the div named detailedChart. ( initially empty ) %> <HTML> <HEAD> <TITLE>FusionCharts - Ajax Based Data Charting Example</TITLE> <%= javascript_include_tag "FusionCharts" %> <style type="text/css"> <!-- body { font-family: Arial, Helvetica, sans-serif; font-size: 12px; } .text{ font-family: Arial, Helvetica, sans-serif; font-size: 12px; } --> </style> <SCRIPT LANGUAGE="JavaScript"> /** * updateChart method is invoked when the user clicks on a pie slice. * In this method, we get the index of the factory after which we request for XML data * for that that factory from factory_chart action via ajax, and finally * update the Column Chart. * @param factoryIndex Sequential Index of the factory. */ function updateChart(factoryIndex){ var strURL = "factory_chart?factory_id=" + factoryIndex; $.ajax({ type: "GET", url: strURL, success: function(msg){ $("#detailedChart").show().html(msg); } }); } </SCRIPT> </HEAD> <BODY> <CENTER> <h4>Inter-connected charts - Click on any pie slice to see detailed chart below.</h4> <p>The charts in this page have been dynamically generated using data contained in a database.</p> <p>The detailed charts along with the dynamic data are received using AJAX.</p> <%= render :partial=>"factory_sum_chart", :locals=>{:factories=> @factories} %> <br/> <div id="detailedChart" style="width:600px;height:300px;"></div> <BR/><BR/> <a href='/NoChart.html' target="_blank">Unable to see the chart above?</a> <BR><h5><%= link_to '« Back to list of examples', :controller=>'fusioncharts/index'%></h5> </CENTER> </BODY> </HTML>
The following steps are carried out in the controller action:
- Find all the factories present in the database. This data is stored in @factories, which is used in the view to show a drop-down of factory names.
- The first factory is taken as default factory. The id, factory name and output quantities for this factory are stored in @factory_id, @factory_name and @factory_output_quantities. These values are used in the view, to show the chart.
Let us next, dissect the view page and see it part by part.
In order to show the chart, we will render a partial _factory_sum_chart passing it the factory id, name and output quantities. The partial renders the chart using FusionChartsHelper and the factory_details builder file. Here, we will not go into the details of the partial and the builder, since they are similar to those seen in Drill Down example and other examples.The resulting chart is shown below:
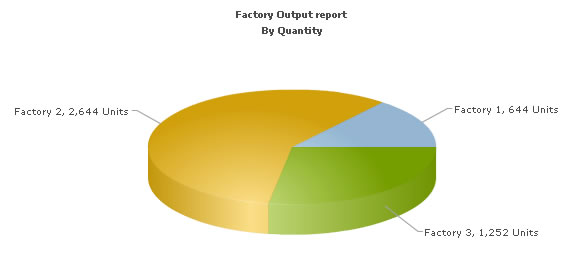
On clicking on a slice in the above pie chart, the chart with that factory's details should be shown below. For this, we will use AJAX. As seen in the above code, we have a div with id "detailedChart" where the factory details chart will be shown. Let us analyze the action and its output. We will come to the javascript code in a minute. The code for this action is:
Controller: Fusioncharts::AjaxExampleController
Action: factory_chart
# This action is called from the javascript function updateChart via ajax
# Expects the request parameter factory_id. Finds the details for the requested factory
# This data is then used by the corresponding view.
# The view renders the chart using the object tag.
 def factory_chart
    @factory_id = params[:factory_id]
    factory = Fusioncharts::FactoryMaster.find(@factory_id)
    @factory_name = factory.name
    @factory_output_quantities = factory.factory_output_quantities
  end
In this action, the expected parameter is factory_id. A look-up is performed and the factory details for this id is obtained. The factory_output_quantities of the factory is stored in @factory_output_quantities. This is passed to the builder factory_details via locals parameter by the corresponding view factory_chart.html.erb.
Note that this action is invoked via ajax in updateChart javascript function.
The view renders the chart using FusionChartsHelper's render_chart_html function and the factory_details builder file. The code is as follows:
<%
	#This page is invoked from default action in controller. When the user clicks on a pie
	#slice rendered by default.html.erb, the factoryId is passed as a parameter to detailed function
	#in the controller. We need to get that factory id, get the information from database and then show
	#a detailed chart.
	# The xml is obtained as a string from builder template.
	str_xml = render :file=>"fusioncharts/db_example/factory_details",
:locals=>{:factory_id=> @factory_id,:factory_name=>@factory_name,:factory_output => @factory_output_quantities}
	#Create the chart - Column 2D Chart with data from strXML
	render_chart_html '/FusionCharts/Column2D.swf', '', str_xml, 'FactoryDetailed', 600, 300, false   do -%>
<% end-%>
As part of ajax response the complete object tag to render the chart is obtained. Let us focus on this javascript function now.
function updateChart(factoryIndex){
	var strURL = "factory_chart?factory_id=" + factoryIndex;
	$.ajax({
		type: "GET",
		url: strURL,
		success: function(msg){
		$("#detailedChart").show().html(msg);
		}
		});
    }
In this function, the following steps are performed:
- Get the index of the factory as parameter
- Request for object embed tag data with xml for selected factory from factory_chart action via ajax, and
- Finally, update the div containing Column Chart.
Note that the Ajax functionality is part of the FusionCharts JS files.
Our job is done. The chart will now get refreshed with details of the selected factory. In this example, we have seen how to use AJAX to update a chart when clicked on a slice in the pie chart.
This is just the beginning of what can be achieved with Ruby on Rails, AJAX and FusionCharts. Keep exploring!