FusionCharts v3 offers tremendous integration capabilities with JavaScript. You can easily use FusionCharts and JavaScript to create client side dynamic charts.
Here, we'll see the JavaScript + Url method - where we ask the chart to fetch new data from server and update itself, without incurring any page refreshes. The entire application resides in a single page which makes it a seamless experience for your end viewers.
Before you proceed with the contents in this page, we strictly recommend you to please go through the sections "How FusionCharts works?" and "Basic Examples", as we'll directly use a lot of concepts defined in those sections.
The code discussed in this example is present in Download Package > Code > J2EE > DB_JS_dataURL folder.
Let us first define what we want to achieve in this example. We'll carry on from our previous drill-down example and convert it into a single page example. In our previous example, we were showing the Production Summary of all the factories in a pie chart. When the user clicked on a pie slice, he was taken to another page, where a detailed date-wise chart was shown for the required factory.
In this example, we'll assimilate both the charts in a single page and make them interact with each other using JavaScript, thereby making the end-user experience smooth. Effectively, we will do the following:
- Contain both the pie chart (summary) and column chart (detailed) in one page (Default.jsp).
- When the page loads, the pie chart would use dataXML method to show summary of all factories. This data will be built in the bean FactoriesBean.
- The column chart would initialize with no data, as the user has not selected a factory initially. We'll customize the "No data to display" message of the chart to show a friendly message.
- The pie chart would have JavaScript links defined for each pie slice. This JavaScript links refer to updateChart() JavaScript function present on the same page. We'll later see how to hand code this function. When a pie is clicked, the factory ID is passed to this function.
- The updateChart() function is responsible for updating the column chart. It generates a dataURL link by including the factoryId as a part of dataURL (FactoryData.jsp). FactoryData.jsp is the data provider page for the detailed column chart. Once the dataURL is built, it conveys this dataURL to the column chart.
- The column chart would now accept this dataURL, send a request to FactoryData.jsp for XML data, accept it, parse it and finally render.
Both the charts and JavaScript functions to manipulate the charts is contained in Default.jsp. It has the following code:
<%@ taglib prefix="c" uri="http://java.sun.com/jsp/jstl/core"%>
<%@ taglib prefix="tags" tagdir="/WEB-INF/tags"%>
<%@ taglib uri="http://www.fusioncharts.com/jsp/core" prefix="fc"%>
<jsp:useBean id="factoriesBean"
class="com.fusioncharts.sampledata.FactoriesBean" />
<jsp:useBean id="chart2Data"
class="com.fusioncharts.sampledata.EmptyRenderData" />
<c:set var="folderPath" value="../../FusionCharts/" />
<c:set var="title" value="FusionCharts - Database + JavaScript Example"
scope="request" />
<c:set var="header1"
value="FusionCharts Database + JavaScript (dataURL method) Example"
scope="request" />
<c:set var="header2"
value="Inter-connected charts - Click on any pie slice to see detailed
chart below."
scope="request" />
<c:set var="intro"
value="The charts in this page have been dynamically generated using
data contained in a database."
scope="request" />
<c:set var="jsPath" value="../../FusionCharts/FusionCharts.js"
scope="request" />
<!--
      In this example, we show a combination of database + JavaScript (dataURL method)
      rendering using FusionCharts.

      The entire app (page) can be summarized as under. This app shows the break-down
      of factory wise output generated. In a pie chart, we first show the sum of quantity
      generated by each factory. These pie slices, when clicked would show detailed date-wise
      output of that factory. The detailed data would be dynamically pulled by the column
      chart from another JSP page. There are no page refreshes required. Everything
      is done on one single page.

      The XML data for the pie chart is fully created in JSP at run-time. JSP interacts
      with the database and creates the XML for this.
      Now, for the column chart (date-wise output report), each time we need the data
      we dynamically submit request to the server with the appropriate factoryId. The server
      responds with an XML document, which we accept and update chart at client side.

-->
<tags:template2>
<SCRIPT LANGUAGE="JavaScript">
   /**
    * updateChart method is invoked when the user clicks on a pie slice.
    * In this method, we get the index of the factory after which we request for XML data
    * for that that factory from FactoryData.asp, and finally
    * update the Column Chart.
    * @param factoryIndex Sequential Index of the factory.
    */
    function updateChart(factoryIndex) {
      //DataURL for the chart
       var strURL = "FactoryData.jsp?factoryId=" + factoryIndex;
       //Sometimes, the above Url and XML data gets cached by the browser.
       //If you want your charts to get new XML data on each request,
       //you can add the following line:
       //strURL = strURL + "&currTime=" + getTimeForURL();
       //getTimeForURL method is defined below and needs to be included
       //This basically adds a ever-changing parameter which bluffs
       //the browser and forces it to re-load the XML data every time.
       //Get reference to chart object using Dom ID "FactoryDetailed"
       var chartObj = FusionCharts('FactoryDetailed');
       //Send request for XML
       chartObj.setXMLUrl(strURL);
    }
   /**
    * getTimeForURL method returns the current time
    * in a Url friendly format, so that it can be appended to
    * dataURL for effective non-caching.
    */
    function getTimeForURL() {
       var dt = new Date();
       var strOutput = "";
       strOutput = dt.getHours() + "_" + dt.getMinutes() + "_"
       + dt.getSeconds() + "_" + dt.getMilliseconds();
       return strOutput;
    }
</SCRIPT>

<!-- Create the chart - Pie 3D Chart with data contained in bean -->
   <fc:render chartId="${factoriesBean.chartId}"
      swfFilename="${folderPath}${factoriesBean.filename}"
      width="${factoriesBean.width}" height="${factoriesBean.height}"
      debugMode="false" xmlData="${factoriesBean.xml}" />
   <!--
      Column 2D Chart with changed "No data to display" message
      We initialize the chart with <chart></chart>
    -->
   <fc:render chartId="${chart2Data.chartId}"
      swfFilename="${folderPath}${chart2Data.filename}${chart2Data.noDataParameter}"
      width="${chart2Data.width}" height="${chart2Data.height}"
      debugMode="false" registerWithJS="true" xmlData="${chart2Data.xml}" />
</tags:template2>
Dissecting the code in this page, we see that,
- This page uses template2 tag file and provides the path to the js file to it via the variable jsPath.
- Then there are the javascript functions, which we will discuss in a while.
- Finally, the two charts are rendered in the page using the fc:render tag.
The data for the first chart is obtained from FactoriesBean and the second chart uses the EmptyRenderData bean.
The data for the second chart will be provided dynamically on clicking on the pie slice in the first chart.
First Chart
The Pie 3D chart is created using dataXML method. The Pie 3D chart has its DOM Id as FactorySum defined in the FactoriesBean:
protected String chartId="FactorySum";
Leaving aside the usual render tag, we will directly jump to the code in the bean used to construct the xml. This is similar to the one we saw in the drill-down example, only the link will be different this time.
private String getFactoryXML(){
  //strXML will be used to store the entire XML document generated
  String strXML="";
  try{
      DBConnection dbConn = new DBConnection();
      Connection oConn= dbConn.getConnection();
     //Database Objects - Initialization
      Statement st1=null,st2=null;
      ResultSet rs1=null,rs2=null;
      String strQuery="";
      Map<String,String> chartAttributes=new HashMap<String, String>();;
      chartAttributes.put("caption", "Factory Output report");
      chartAttributes.put("subCaption", "By Quantity");
      chartAttributes.put("pieSliceDepth", "30");
      chartAttributes.put("showBorder", "1");
      chartAttributes.put("formatNumberScale", "0");
      chartAttributes.put("numberSuffix", " Units");
      DOMHelper domHelper = new DOMHelper();
      Document chartDoc = domHelper.getDocument();
      Element rootElement = chartDoc.createElement("chart");
      domHelper.addAttributesToElement(rootElement, chartAttributes);
      //Iterate through each factory
      strQuery = "select * from Factory_Master";
      st1=oConn.createStatement();
      rs1=st1.executeQuery(strQuery);
      String factoryId=null;
      String factoryName=null;
      String totalOutput="";
      while(rs1.next()) {
        totalOutput="";
        factoryId=rs1.getString("FactoryId");
        factoryName=rs1.getString("FactoryName");
        //Now create second recordset to get details for this factory
        strQuery = "select sum(Quantity) as TotOutput from Factory_Output where FactoryId=" + factoryId;
        st2=oConn.createStatement();
        rs2 = st2.executeQuery(strQuery);
        if(rs2.next()){
          totalOutput=rs2.getString("TotOutput");
        }
        //Generate <set label='..' value='..'/>
        Element setElem = chartDoc.createElement("set");
        setElem.setAttribute("label", factoryName);
        setElem.setAttribute("value", totalOutput);
        setElem.setAttribute("link", "javaScript:updateChart("+factoryId + ")");
        rootElement.appendChild(setElem);
        //close the resultset,statement
        //enclose them in try catch block
        //code omitted here
    }
    //Finally, close <chart> element
    chartDoc.appendChild(rootElement);
    strXML=domHelper.getXMLString(chartDoc);
    //close the resultset,statement,connection
    //enclose them in try catch block
    //code omitted here
  }catch(java.sql.SQLException e){
    System.out.println("Could not close the statement");
  }
  return strXML;
}
We have provided the link to the updateChart javascript function with factoryId as the parameter. Since we are using dom to create the xml, our code for this turns out to be:
setElem.setAttribute("link", "javaScript:updateChart("+factoryId + ")");
Drill-down Chart
The chart obtained on drilling-down is present in the same page, Default.jsp. The data to this chart is obtained from the javascript function updateChart. (which in turn contacts FactoryData.jsp for detailed data for the factory)
We first create the XML data document for Pie chart - summary of factory output. For each <set>, we provide a JavaScript link to the updateChart() function and pass the factory ID to it as shown in the line below:
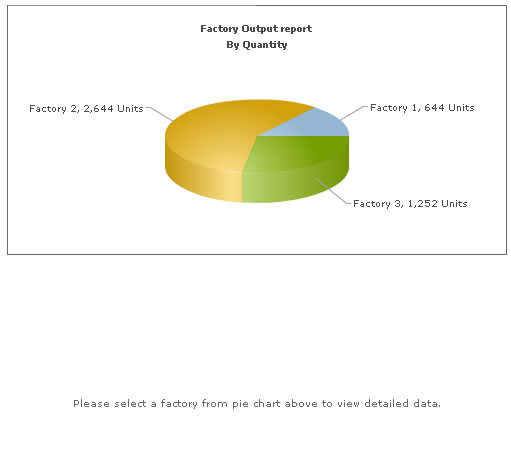
For the second chart, we render an empty Column 2D chart with <chart></chart> data initially. We also change the "No data to display." error to a friendly and intuitive "Please select a factory from pie chart above to view detailed data." This chart has its DOM Id as FactoryDetailed. (in EmptyRenderData.java)
protected String chartId="FactoryDetailed";
This chart has to be registered with JavaScript since it obtains its data through javascript. This can be done by setting the registerWithJS attribute to true as shown:
<fc:render chartId="${chart2Data.chartId}"
swfFilename="${folderPath}${chart2Data.filename}${chart2Data.noDataParameter}"
width="${chart2Data.width}" height="${chart2Data.height}"
debugMode="false" registerWithJS="true" xmlData="${chart2Data.xml}" />
The pie chart shows the summary data provided to it using dataXML way. The column chart shows the above "friendly" error message. Now, when each pie slice is clicked, the updateChart() JavaScript function is called and the factoryID of the pie is passed to it. This function is responsible for updating the column chart and contains the following code:
function updateChart(factoryIndex){
  //DataURL for the chart
  var strURL = "FactoryData.jsp?factoryId="
      + factoryIndex;
  //Sometimes, the above Url and XML data gets cached by the browser.
  //If you want your charts to get new XML data on each request,
  //you can add the following line:
  //strURL = strURL + "&currTime=" + getTimeForURL();
  //getTimeForURL method is defined below and needs to be included
  //This basically adds a ever-changing parameter which bluffs
  //the browser and forces it to re-load the XML data every time.
  //Get reference to chart object using Dom ID "FactoryDetailed"
  var chartObj = FusionCharts("FactoryDetailed");
  //Send request for XML
  chartObj.setXMLUrl(strURL);
}
Here,
- We first create a dataURL string by appending the factoryID to FactoryData.jsp.
- Finally, we convey this dataURL to the column chart. To do so, we first get a reference to the column chart using its DOM Id FactoryDetailed. We use the function defined for FusionCharts object to do so.
- Once we've the reference to the chart, we simply call the setXMLUrl method of the chart and pass it the Url to request data from.
- This updates the chart with new data.
This completes our front-end for the chart. We now just need to build FactoryData.jsp page, which is responsible to provide detailed data to column chart. It contains the following code:
<%@ taglib prefix="c" uri="http://java.sun.com/jsp/jstl/core"%>
        <jsp:useBean id="detailsBean"
class="com.fusioncharts.sampledata.FactoryDetailsBean" />
<c:set target="${pageContext.response}" property="contentType" value="text/xml"/>
<c:set target="${detailsBean}" property="factoryId" value="${param.factoryId}"/>
<c:out value="${detailsBean.xml}" escapeXml="false"/>
In this page, we basically request the factory Id passed to it as querystring, set it to the bean FactoryDetailsBean, obtain the xml from the bean and finally write it to output stream.
The construction of the xml in the bean is done every time the setFactoryId method is called. The code for building the xml for the given factoryId is shown below: (getFactoryDetailsXML(String factoryId))
//strXML will be used to store the entire XML document generated
String strXML="";
try{
  DBConnection dbConn = new DBConnection();
  Connection oConn= dbConn.getConnection();
  //Database Objects - Initialization
  Statement st=null;
  ResultSet rs=null;
  java.sql.Date date=null;
  java.util.Date uDate=null;
  String uDateStr="";
  String quantity="";
  String strQuery="";
  Map<String,String> chartAttributes=new HashMap<String, String>();
  chartAttributes.put("caption", "Factory "+factoryId+" Output");
  chartAttributes.put("subCaption", "(In Units)");
  chartAttributes.put("xAxisName", "Date");
  chartAttributes.put("showValues", "1");
  chartAttributes.put("labelStep", "2");
  chartAttributes.put("palette", "2");
  DOMHelper domHelper = new DOMHelper();
  Document chartDoc = domHelper.getDocument();
  Element rootElement = chartDoc.createElement("chart");
  domHelper.addAttributesToElement(rootElement, chartAttributes);

  //Now, we get the data for that factory
  strQuery = "select * from Factory_Output where FactoryId=" + factoryId+ " order by DatePro Asc ";

  st=oConn.createStatement();
  rs=st.executeQuery(strQuery);

  while(rs.next()) {
    date=rs.getDate("DatePro");
    quantity=rs.getString("Quantity");
    if(date!=null) {
      uDate=new java.util.Date(date.getTime());
      SimpleDateFormat sdf=new SimpleDateFormat("dd/MM");
      uDateStr=sdf.format(uDate);
    }
  //Generate <set label='..' value='..'/>
  Element setElem = chartDoc.createElement("set");
  setElem.setAttribute("label", uDateStr);
  setElem.setAttribute("value", quantity);
  rootElement.appendChild(setElem);
  }
  //Finally, close <chart> element
  chartDoc.appendChild(rootElement);
  strXML=domHelper.getXMLString(chartDoc);
  //close the resultset,statement,connection
  //enclose them in try catch block
  // code omitted here
  }catch(java.sql.SQLException e){
    System.out.println("Could not close the statement");
  }
return strXML;
}
Notice that we have used DOM to create the xml here.
We iterate through each record in the table Factory_Output for the factory with the given factoryId. The output details are then appended to the xml.
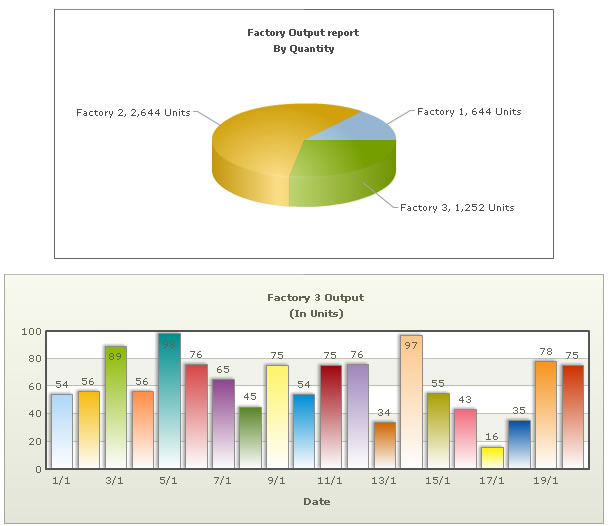
When you now see the application, the initial state would look as under:
And when you click on a pie slice, the following would appear on the same page (without involving any browser refreshes):